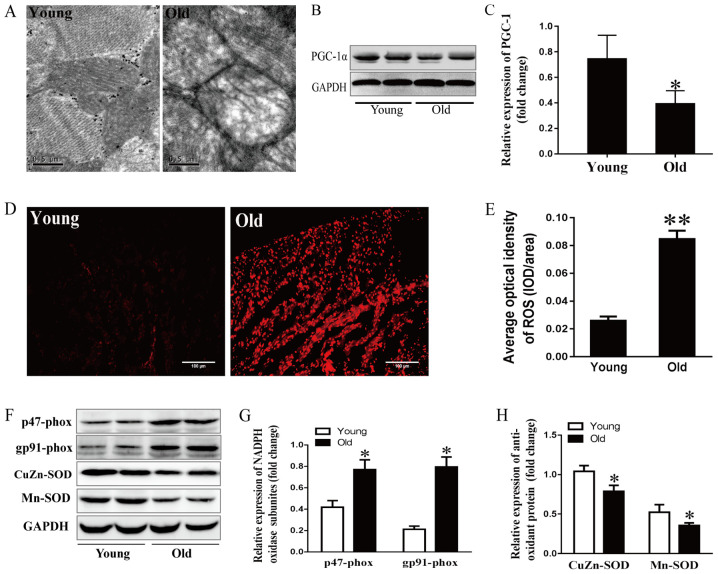
Figure 4.
Effects of aging on mitochondrial stress and the redox state. (A) Mitochondrial ultrastructure of myocytes detected by electron microscopy; scale bar, 0.5 µm. (B) Representative immunoblots and (C) semi-quantitation of PGC-1α. (D) ROS levels detected by DHE fluorescence staining and (E) corresponding semi-quantification; scale bar, 50 µm. (F) Representative immunoblots of p47-phox, gp91-phox, CuZn- and Mn-SOD. (G) Semi-quantification of p47-phox and gp91-phox. (H) Semi-quantification of CuZn-SOD and Mn-SOD. Data are presented as the means ± standard error of the mean from each group; n=8 per group. *P<0.05, **P<0.01 vs. young group. DHE, dihydroethidium; NADPH, nicotinamide adenine dinucleotide phosphate; PGC-1α, peroxisome proliferator-activated receptor γ coactivator-1α; ROS, reactive oxygen species; SOD, superoxide dismutase.

