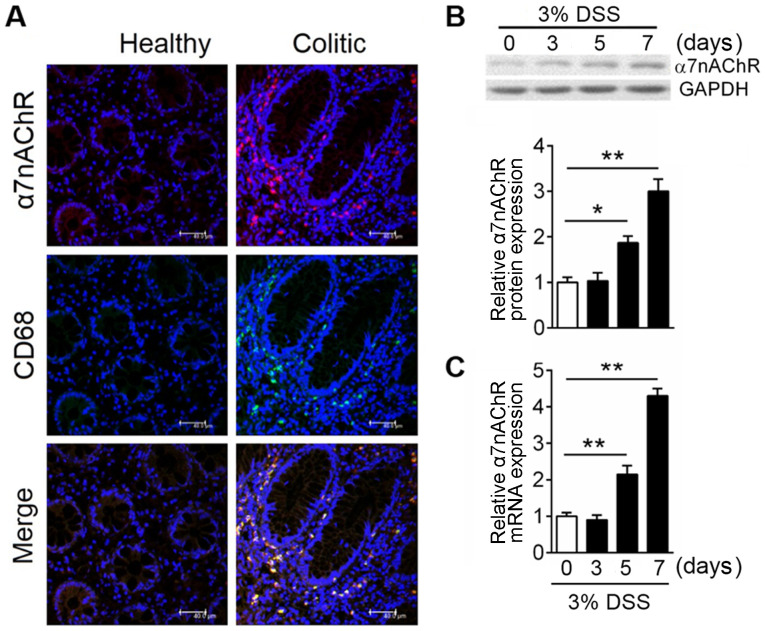
Figure 1.
Macrophages drive increased α7nAChR expression in IBD. In the experimental model, colitis was induced with 3% DSS in C57BL/6 mice, mice were sacrificed at the indicated time points and the colon was excised for protein and mRNA expression analysis. (A) Representative images of immunofluorescence analyses of colonic mucosal tissue in healthy and colitic mice. α7nAChR is in red; CD68 is in green expressions; DAPI is in blue. Co-localization of the α7nAChR and macrophage markers are displayed in merged images. Scale bar, 40 µM. Relative expression levels of α7nAChR (B) protein and (C) mRNA were analyzed by western blotting and reverse transcription-quantitative PCR, respectively, in DSS-induced colitis mice at days 0, 3, 5 and 7; GAPDH was used as internal reference for both. Data are expressed as the mean ± SD of three independent experiments; n=5–7 mice/group; *P<0.05, **P<0.01. α7nAChR, α7 nicotinic acetylcholine receptor; DSS, dextran sulfate sodium; IBD, inflammatory bowel disease.

