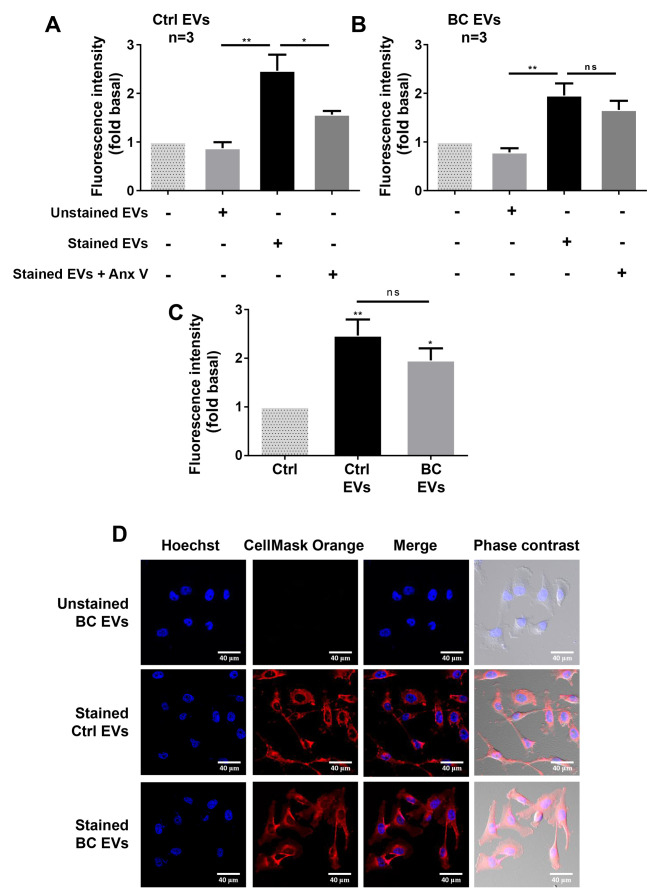
Figure 3.
EVs from plasma of healthy and breast cancer groups are taken up by MDA-MB-231 cells. (A and B) Flow cytometry analysis of MDA-MB-231 cells incubated with unstained or stained Ctrl EVs and unstained or stained BC EVs. Controls of cells without treatment with EVs and uptake inhibition (Annexin V) were included. (C) Comparison of stained EVs uptake between MDA-MB-231 cells treated with stained BC EVs and stained Ctrl EVs. (D) Confocal microscopy analysis of MDA-MB-231 cells incubated with unstained BC EVs, stained Ctrl EVs, stained BC EVs and nucleus stained with Hoechst dye. Scale bar, 40 µm. Data are presented as the mean fluorescence intensities ± SD, and indicate the fold of fluorescence intensity above Ctrl and Ctrl EVs. *P<0.05, **P<0.01 vs. Ctrl or as indicated. ns, not significant; Ctrl, control; EVs, extracellular vesicles; Ctrl EVs, EV fractions obtained from healthy women; BC EVs, EV fractions obtained from women with breast cancer.

