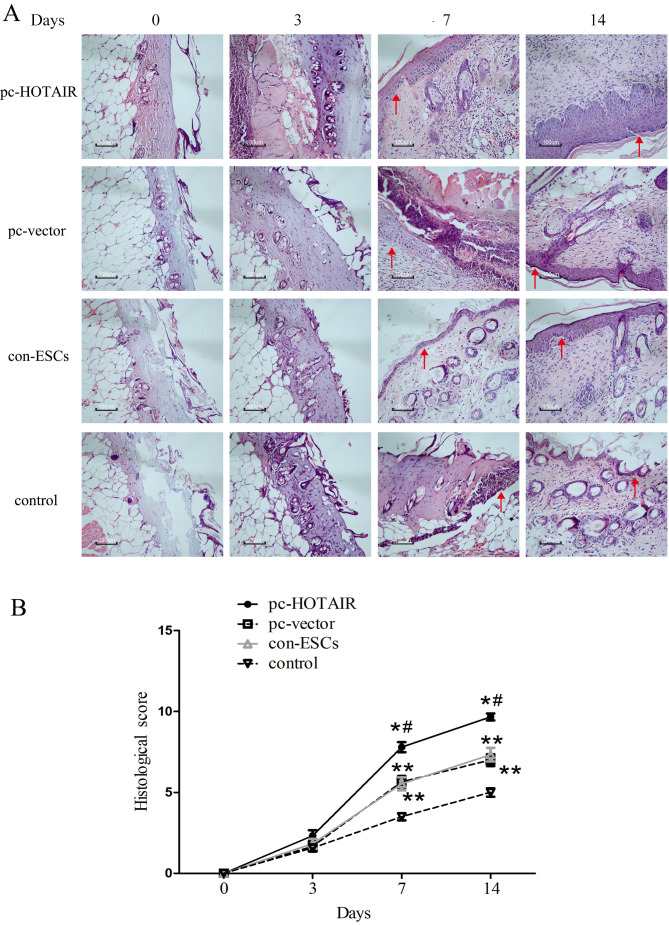
Figure 5.
Histological analysis of burn wounds (n=5). (A) Representative images of wound histological staining at 0, 3, 7 and 14 days post-burn. Scale bar=100 µm. Arrowheads indicate the newly generated epidermis or wound surfaces. (B) Histological scores at 0, 3, 7 and 14 days post-burn. Values are presented as the mean ± standard deviation. *P<0.05 pc-HOTAIR group vs. pc-vector and con-ESCs groups. #P<0.05 pc-HOTAIR group vs. control group (physiological saline solution without ESCs). **P<0.05 pc-vector group or the con-ESCs group vs. the control group. HOTAIR, HOX antisense intergenic RNA; ESC, epidermal stem cell; pc, overexpression plasmid; con, parental control cells; d, days.

