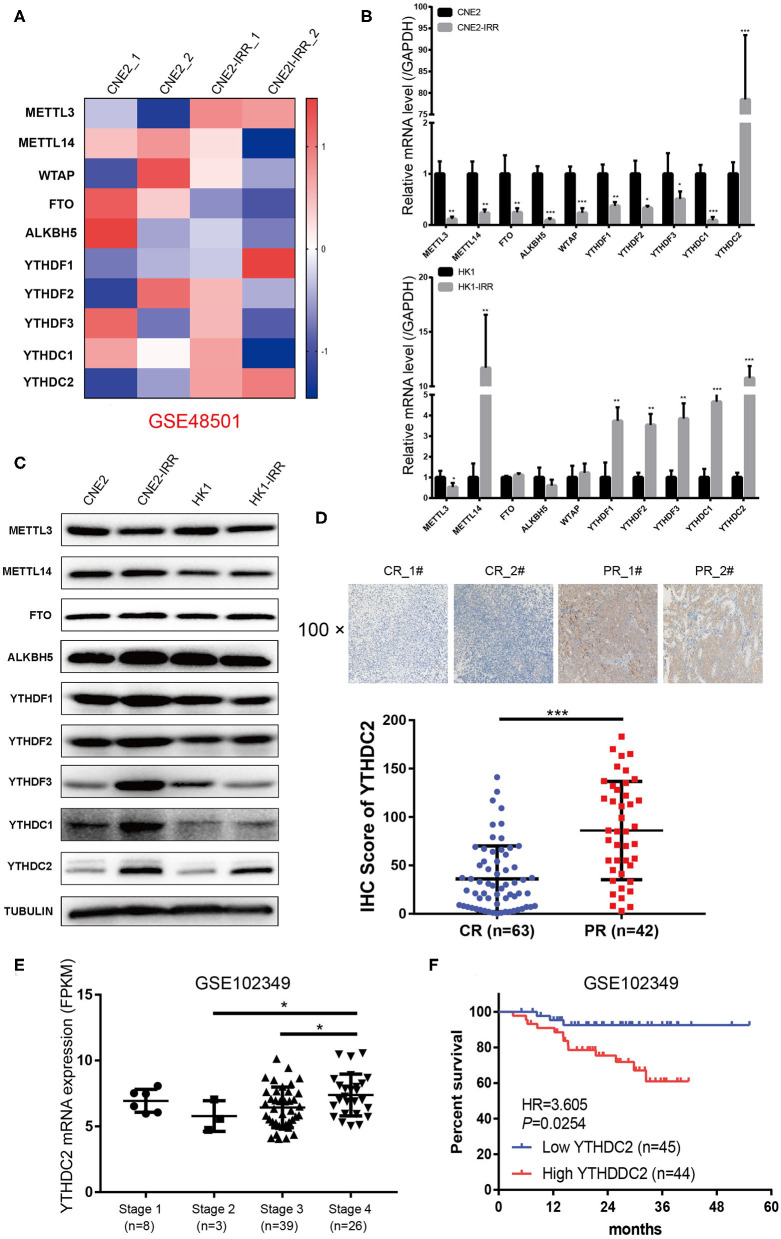
Figure 1.
YTHDC2 is upregulated in radiation-resistance NPC cells. (A) Heat map showing the expression of m6A relevant genes in CNE2 and CEN2-IRR cells. The shades of red and blue represent increases and decreases in the expression of the corresponding genes, respectively. Data were generated in independent experiments (1 and 2). (B,C) mRNA (B) and protein (C) expression of the m6A relevant genes in CNE2, CNE2-IRR, HK1, and HK1-IRR cells. Data are presented as mean ± SD from n = 3. *P < 0.05, **P < 0.01, ***P < 0.001, student's t test. (D) H-Score of YTHDC2 in NPC sample with complete response and with partial response after radiotherapy. Up-panel showed representative images of YTHDC2 protein level examined in NPC CR and PR tissues using immunohistochemistry (shown in 100×magnifications). ***P < 0.001, student's t test. (E) scatter plots comparing levels of YTHDC2 mRNA in different clinical stage groups of NPC samples from GSE102349. *P < 0.05, Student's t-test. (F) Recurrence-free survival rate analysis base on YTHDC2 mRNA expression in NPC patients from GSE102349.

