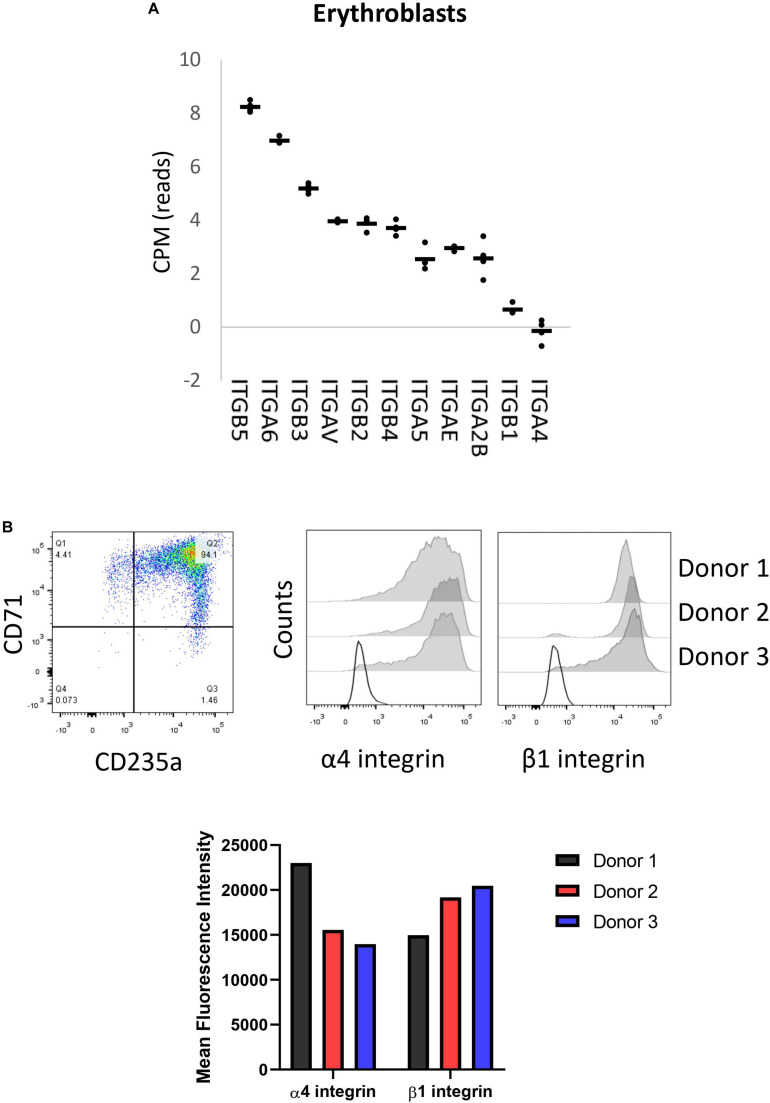
FIGURE 1.
Erythroblasts integrin expression. (A) Integrin mRNA expression (count per million) in CD71+/CD235a+ erythroblasts; data mined from Heshusius et al. (2019). Gene expression was found for 11 integrin subunits: six α sub-units (ITGA) and five β sub-units (ITGB; n = 4). (B) Dot plot showing a representative CD71/CD235 expression plot depicting the erythroblast stage of analysis. Right histograms and bar graph indicate expression of α4 integrin and β1 integrin in CD71+CD235a+ erythroblasts in 3 donors as measured by flow cytometry.

