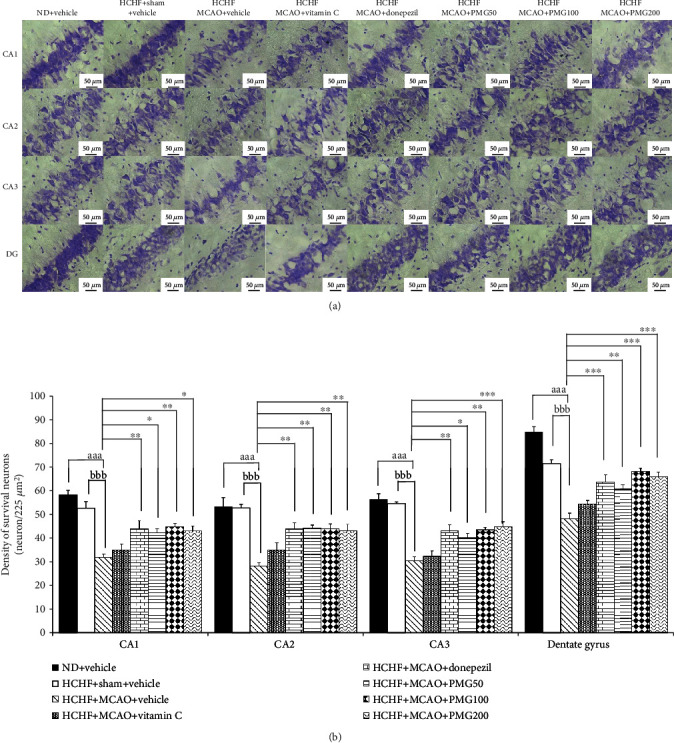
Figure 7.

Effect of PMG on neuron density in various subregions of the hippocampus. (a) Light microscopy of coronal sections in CA1, CA2, CA3, and dentate gyrus of the hippocampus which were stained with cresyl violet at 40x magnification. (b) Density of survival neurons in CA1, CA2, CA3, and dentate gyrus of the hippocampus. Data are presented as mean ± SEM (n = 6/group). aaap value < 0.001; compared between naïve control which received a normal diet and vehicle and MetS+MCAO rats which received HCHF, MCAO, and vehicle. bbbp value < 0.001; compared between sham rats which received HCHF, sham operation, and vehicle and MetS+MCAO rats which received HCHF, MCAO, and vehicle. ∗p value < 0.05, ∗∗p value < 0.01, and ∗∗∗p value < 0.001; compared to MetS+MCAO rats which received HCHF, MCAO, and vehicle. ND: normal diet; HCHF: high-carbohydrate high-fat diet; MetS: metabolic syndrome; MCAO: middle cerebral artery occlusion; Vitamin C: vitamin C at a dose of 250 mg·kg−1 BW; Donepezil: donepezil at a dose of 3 mg·kg−1 BW; PMG50, PMG100, and PMG200: the phytosomes containing the combined extract of mulberry fruit and ginger at doses of 50, 100, and 200 mg·kg−1 BW, respectively.
