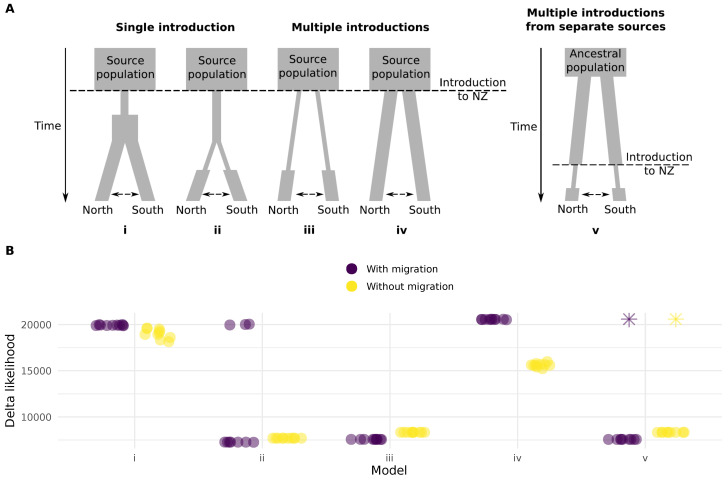
Figure 3.
Models used to simulate site frequency spectra (SFS) for comparison against the observed SFS. (A) Models i and ii represent introduction via a single route. In model i the population contracts on introduction and then begins expanding before dispersal. In model ii, dispersal occurs while the effective population size remains small. Models iii and iv represent multiple routes of entry, with or without reduction in population size compared to the current populations in New Zealand. Model v represents introduction to different sites from source populations that were isolated prior to introduction. All models were tested with and without migration between Northern and Southern populations. (B) Likelihood estimations from ten runs of each model. We used 1M simulations and 60 optimisation cycles per run [46]. Runs that ended with a non-finite delta likehood after 1M simulations are shown as an asterisk. The models that include a bottleneck after separation of the two populations had the lowest delta likelihoods, and model iii (with migration) had the lowest mean delta likelihood across runs.

