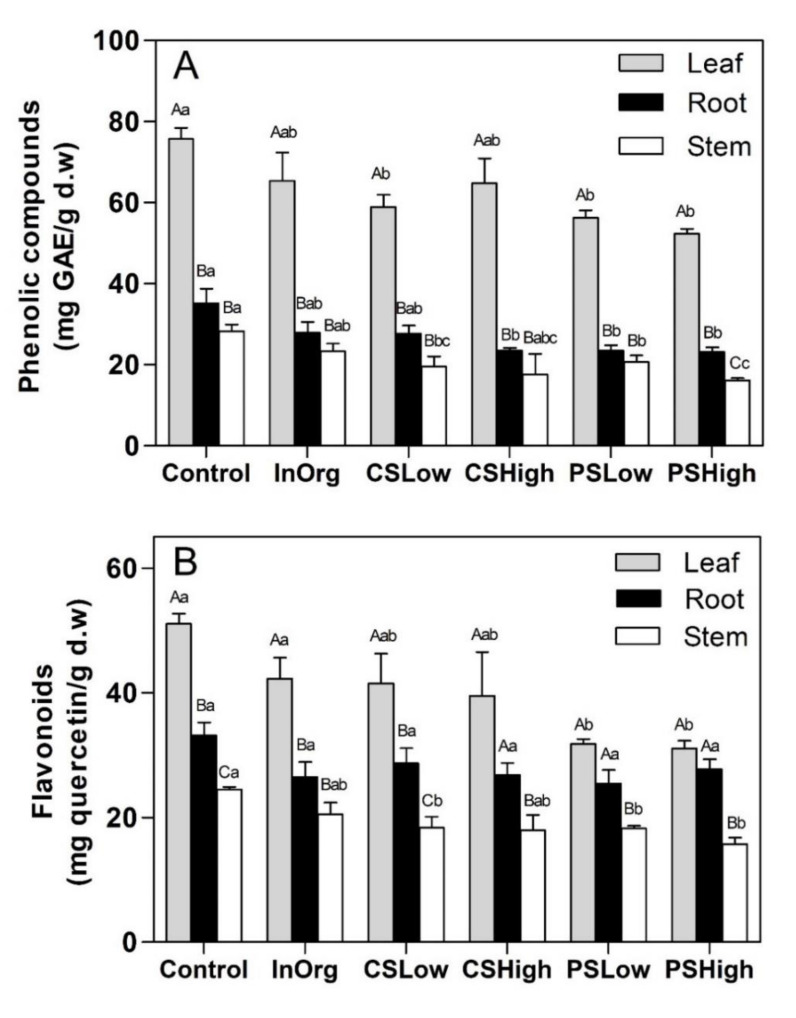
Figure 4.
(A) Total phenolics and (B) total flavonoids in leaves, roots and stems of Rosmarinus officinalis plants in the various fertilization treatment groups: InOrg, CSLow, CSHigh, PSLow and PSHigh. Vertical bars indicate standard errors of the mean (n = 3). Different lowercase letters indicate significant differences among fertilization treatments (p < 0.05). Different capital letters indicate significant differences among plant parts (p < 0.05).

