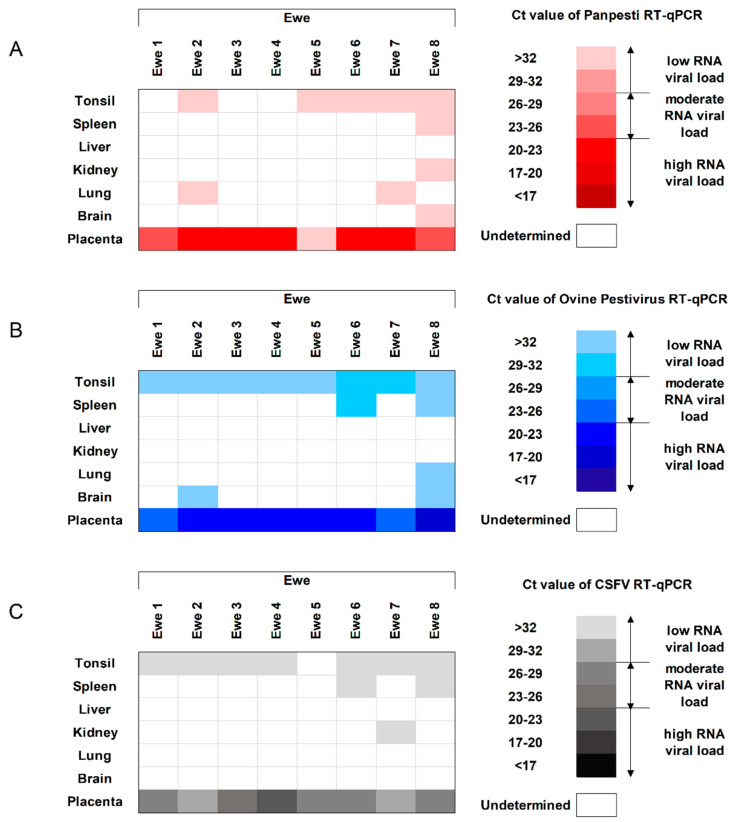
Figure 3.
Detection of OVPV RNA in ewe tissues. The OVPV RNA analyzed by (A) Pestivirus RT-qPCR [21], (B) the new specific OVPV RT-qPCR, and (C) specific CSFV RT-qPCR [22]. The RNA load, according with the Ct value, is represented as low, moderate, or high by the intensity of the red, blue and gray colors in the scale for (A–C), respectively. Ct values above 40 were considered as negative.

