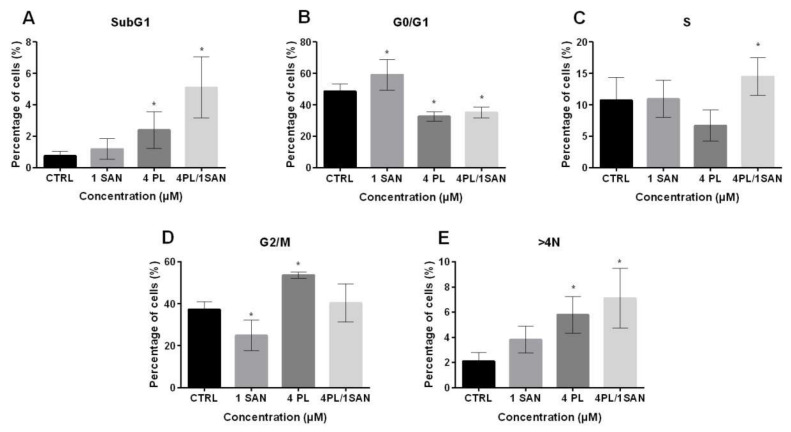
Figure 5.
The effects of piperlongumine (PL) and sanguinarine (SAN) individually and in a combined treatment on the cell cycle of A549 cells. The percentage of cells in SubG1 phases (A), G0/G1 (B), S (C), G2/M (D) and >4N (E). Data represent the mean values ± SD obtained from 6 independent replicates (n = 6). Statistically significant differences in comparison to untreated cells were marked as * (p < 0.05; Kruskal-Wallis with Dunn’s post hoc test).

