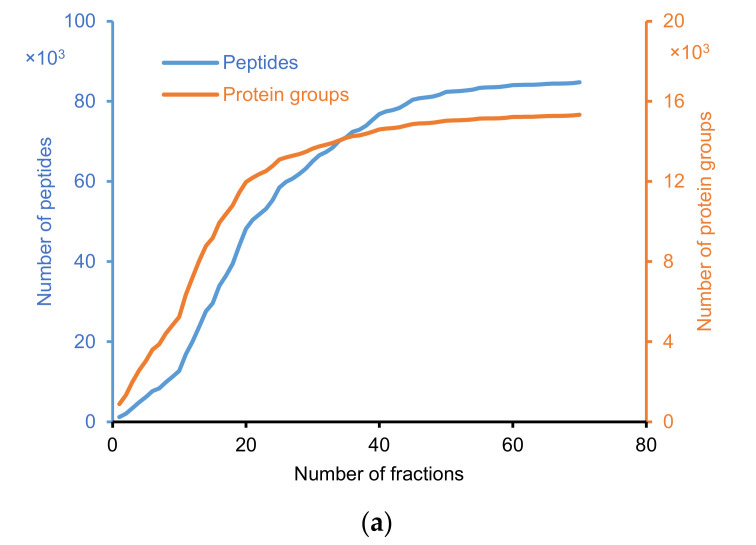
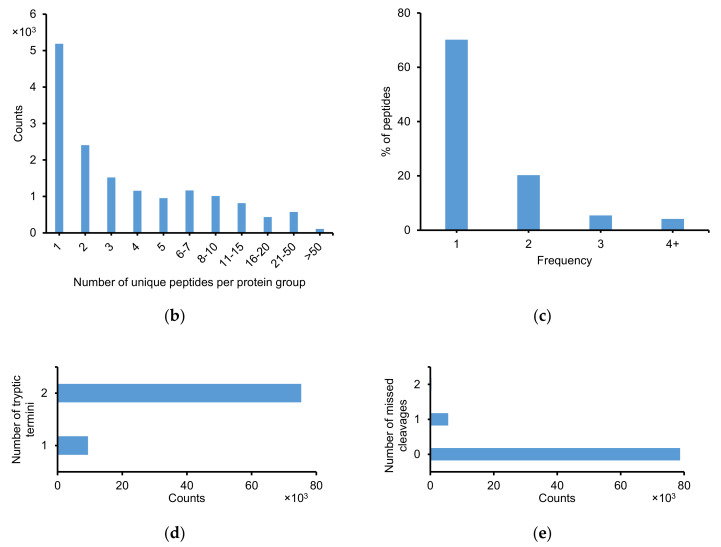
Figure 2.
Summary of the results from proteomic profiling of E. huxleyi using 3D-LC system. (a) The accumulated numbers of identified peptides and protein groups (single hit included) versus the number of fractions. (b) Number of unique peptides per protein group. (c) Distribution of peptides by frequencies in 70 fractions. (d) Number of tryptic termini in identified peptides. (e) Number of missed cleavages in identified peptides.


