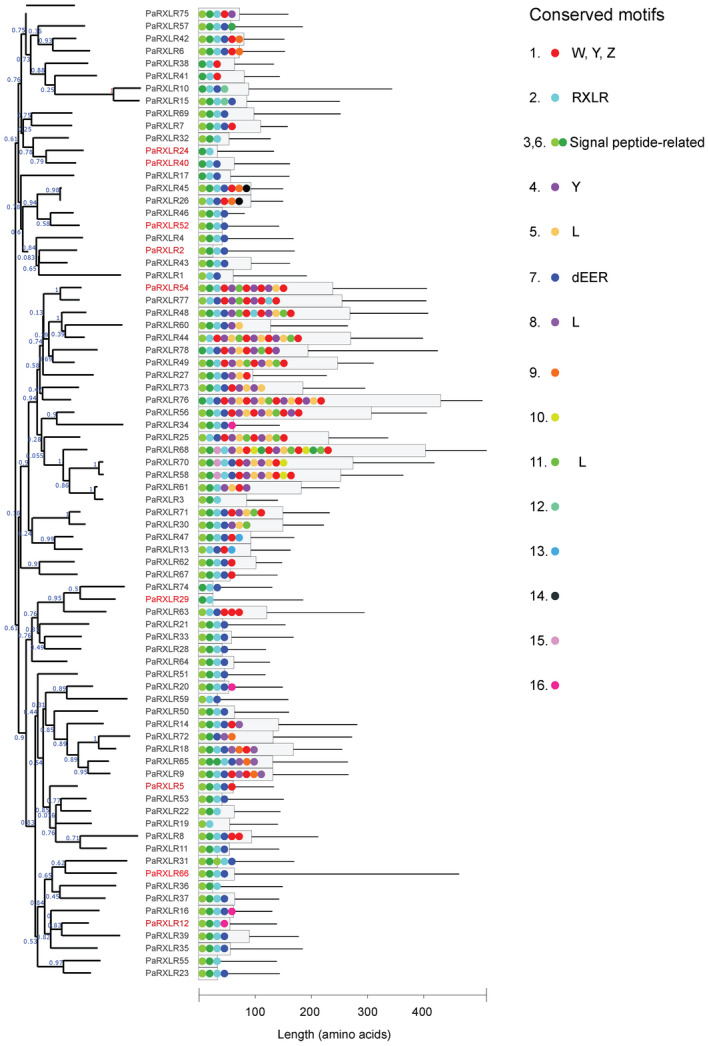
Figure 1.

Phylogeny and domain structure of the Phytophthora agathidicida RXLR effector candidates. The dendrogram represents a maximum‐likelihood phylogenetic tree. Numbers on the branches are approximate likelihood ratio test (aLRT) values as reported by PhyML. PaRXLRs with names in red are those that either elicited or suppressed cell death in functional assays. The histogram shows lengths of predicted proteins (thin black lines), according to the scale below, and the proportion of proteins involved in amino acid motifs that were significantly over‐represented among the 78 RXLRs as predicted by MEME (grey boxes). Coloured dots represent the motifs, with the order respected but not drawn to scale. The key indicates conserved motifs, with putative functions or similarities to common RXLR motifs indicated where appropriate; the numbers correspond to those detailed in Figure S2
