
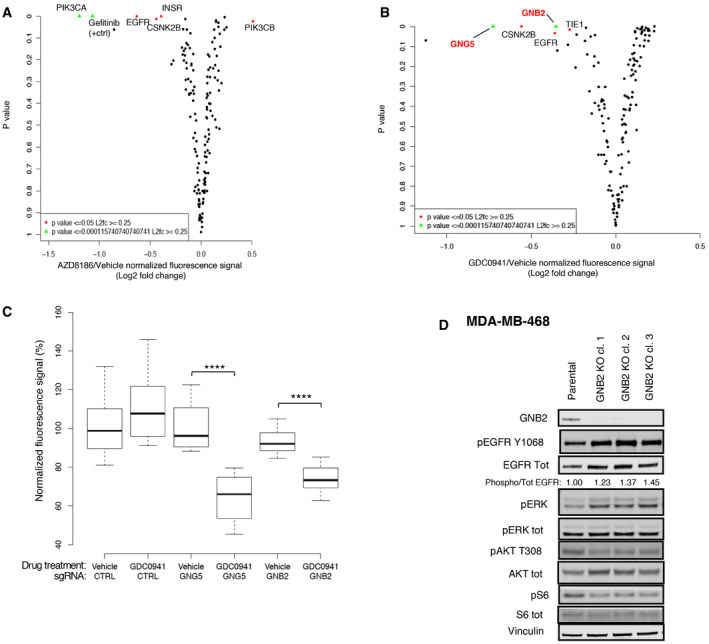
Figure 4. A CRISPR‐Cas9 screening identified GNB2 as a target to potentiate the inhibition mediated by pan‐PI3K inhibitor.
-
A, BResults of CRISPR‐Cas9 screening in combination with AZD8186 100 nM (A) or GDC0941 400 nM (B). The dot‐plots show for each gene knocked‐out by sgRNAs the fold change (log2) between treated conditions (AZD8186 or GDC0941, respectively) and vehicle in the fluorescence signal (anti‐phosphoS6 immunofluorescence) vs the P‐value of the difference calculated by two‐sided t‐test. The plots represent means of biological triplicates. Genes for which it was calculated a P < 0.0001 and Log2 (fold change) > 0.25 are reported and highlighted in green; genes having a 0.0001 < P < 0.05 and a Log2 (fold change) > 0.25 are reported and shown in red. Gefitinib combined with AZD8186 represents the positive control of the experiment (A).
-
CBox and whisker plot showing the fold change in fluorescence signal between vehicle and GDC0941‐treated conditions for MDA‐MB‐468 cells transduced with non‐target control, GNB2, or GNG5 sgRNAs (N = 2 or 3). Data presented in a box and whisker plot with the central band indicating the median, the upper, and lower extremes of the box or hinge being the third and first quartiles, respectively, and the whiskers extending to the most extreme data values within 1.5 times the inter‐quartile range. Statistical significance of unpaired t‐test ****P < 0.0001.
-
DBiochemical analysis of GNB2 KO cells. Cell lysates of MDA‐MB‐468 parental cells and three MDA‐MB‐468 GNB2 KO clones were probed with the indicated antibodies. Quantification of the bands was performed by ImageLite software.
Source data are available online for this figure.