
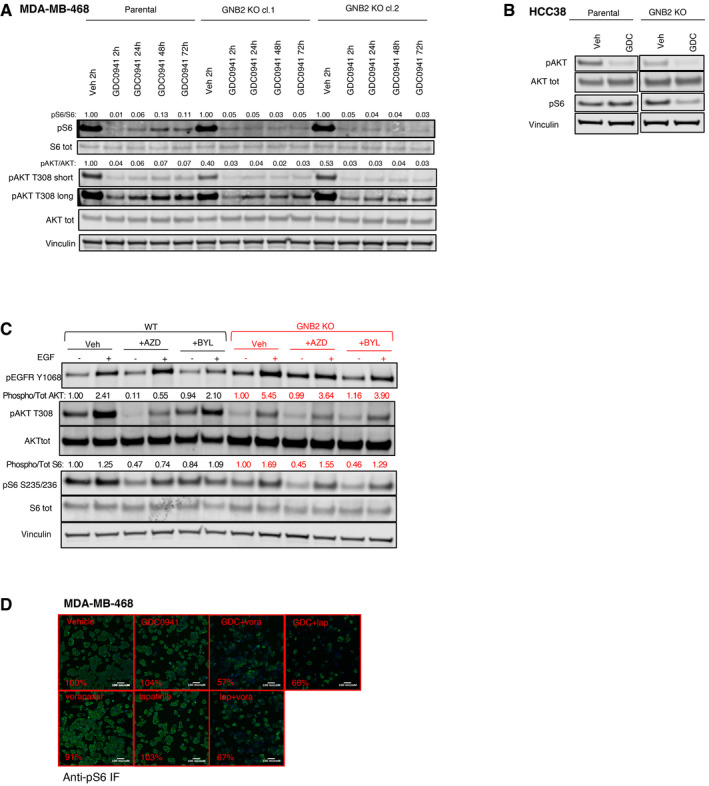
Figure EV5. GNB2 KO modifies the sensitivity to different inhibitors of EGFR‐PI3K pathway. Related to Fig 5 .
-
AMDA‐MB‐468 parental cells or GNB2 KO clones were treated for the indicated times with vehicle or pan‐PI3K inhibitor GDC0941 450 nM. The cell lysates were probed with the indicated antibodies. Quantification of the bands was performed by ImageLite software.
-
BHCC38 parental or GNB2 KO cells were incubated with vehicle or GDC0941 1 μM for 24 h. Cell lysates were probed with the indicated antibodies.
-
CBiochemical impact of PI3K isoform‐specific inhibitors on MDA‐MB‐468 WT and GNB2 KO. MDA‐MB‐468 parental or GNB2 KO cells were starved overnight, pre‐treated for 1 h with vehicle, AZD8186 250 nM, or BYL719 2 μM and then stimulated with vehicle or EGF 10 ng/ml for 10 min. The cell lysates were probed with the indicated antibodies. Quantification of the bands was performed by ImageLite software.
-
DPAR1 signals through GNB2 to sustain the activation of PI3K pathway in the presence of PI3K or HER inhibitors. Representative immune‐fluorescence stainings by phospho‐S6 antibody from the GPCR compound screening performed on MDA‐MB‐468 and showing cells treated with the indicated compounds. pS6 green signal was from Alexa Fluor‐488 conjugate secondary antibody, while nuclei stained by DAPI are shown in blue. The quantification was performed by Cellomics ArrayScan VTI high content microscopy software, and percentages of DAPI‐normalized pS6 signal compared to vehicle control are reported for each treatment condition.