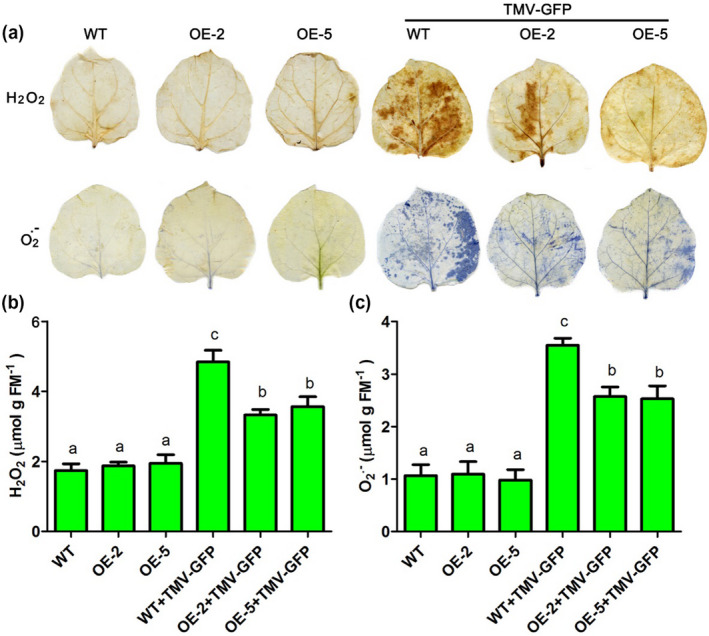
Figure 5.

The levels of reactive oxygen species (ROS) were measured in leaves of wild‐type and transgenic lines OE‐2 and OE‐5 inoculated with TMV‐green fluorescent protein (GFP) (at 3 days postinoculation, dpi). (a) The levels of and H2O2 were determined by nitroblue tetrazolium (NBT) and 3,3′‐diaminobenzidine (DAB) staining of WT and transgenic lines OE‐2 and OE‐5 after TMV‐GFP infection. (b) H2O2 content was measured using a sensitive quantitative Amplex red hydrogen peroxide/peroxidase assay kit. (c) content was examined by the hydroxylamine oxygenation reaction method. WT, nontransformed wild‐type Nicotiana benthamiana plants inoculated with 0.02 M phosphate‐buffered saline (PBS); OE‐2, α‐MMC‐transgenic N. benthamiana line 2 inoculated with 0.02 M PBS; OE‐5, α‐MMC‐transgenic N. benthamiana line 5 inoculated with 0.02 M PBS; WT + TMV‐GFP, leaves of nontransformed WT N. benthamiana plants inoculated with TMV‐GFP (at 3 dpi); OE‐2 + TMV‐GFP, leaves of α‐MMC‐transgenic N. benthamiana line 2 inoculated with TMV‐GFP (at 3 dpi); OE‐5 + TMV‐GFP, leaves of α‐MMC‐transgenic N. benthamiana line 5 inoculated with TMV‐GFP (at 3 dpi). Bars represent mean and SD of values obtained from three biological replicates. Significant differences (p < .05) are denoted by different lowercase letters
