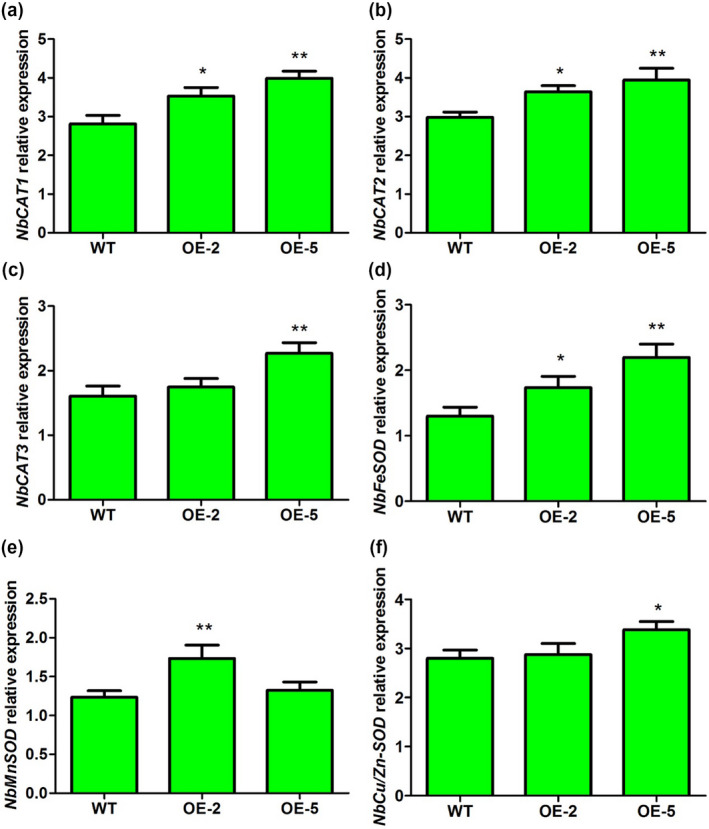
Figure 7.

Quantitative reverse transcription PCR analysis of the expression of catalase (CAT) and superoxide dismutase (SOD) genes in wild‐type (WT) and transgenic lines OE‐2 and OE‐5. WT, nontransformed WT Nicotiana benthamiana plants; OE‐2 and OE‐5, α‐MMC‐transgenic N. benthamiana lines. Bars represent mean and SD of values obtained from three biological replicates. Asterisks represent significant difference determined by Student's t test (*p < .05; **p < .01)
