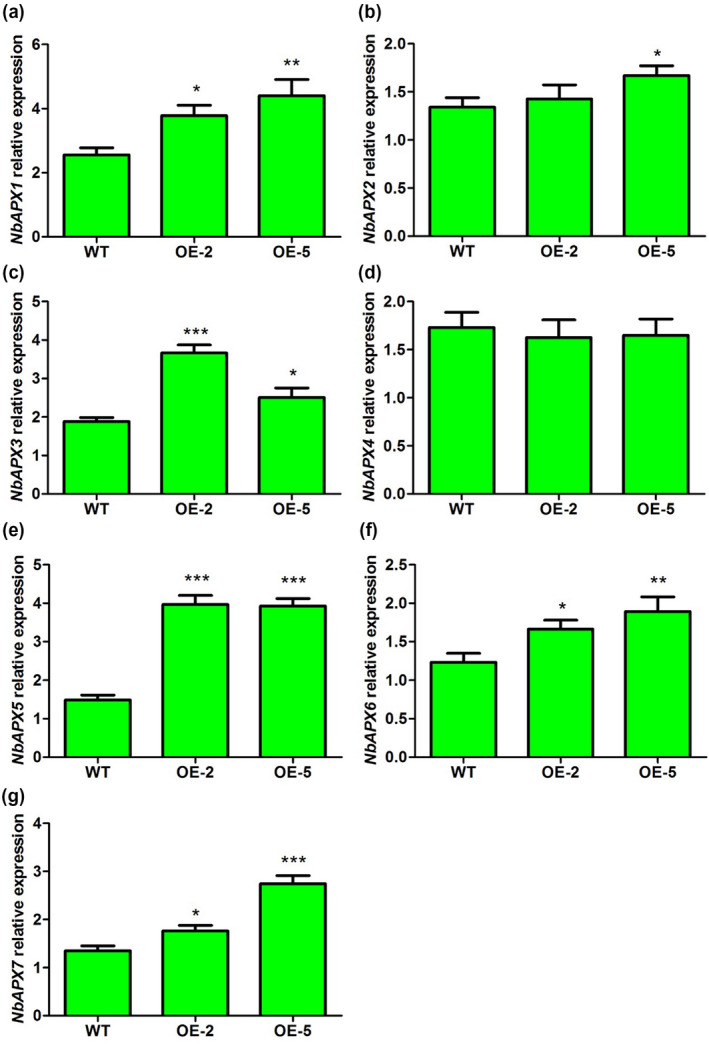
Figure 8.

Quantitative reverse transcription PCR analysis of the expression of ascorbate peroxidase (APX) genes in wild‐type (WT) and transgenic lines OE‐2 and OE‐5. WT, nontransformed WT Nicotiana benthamiana plants; OE‐2 and OE‐5, α‐MMC‐transgenic N. benthamiana lines. Bars represent mean and SD of values obtained from three biological replicates. Asterisks represent significant differences determined by Student's t test (*p < .05; **p <.01; ***p < .001)
