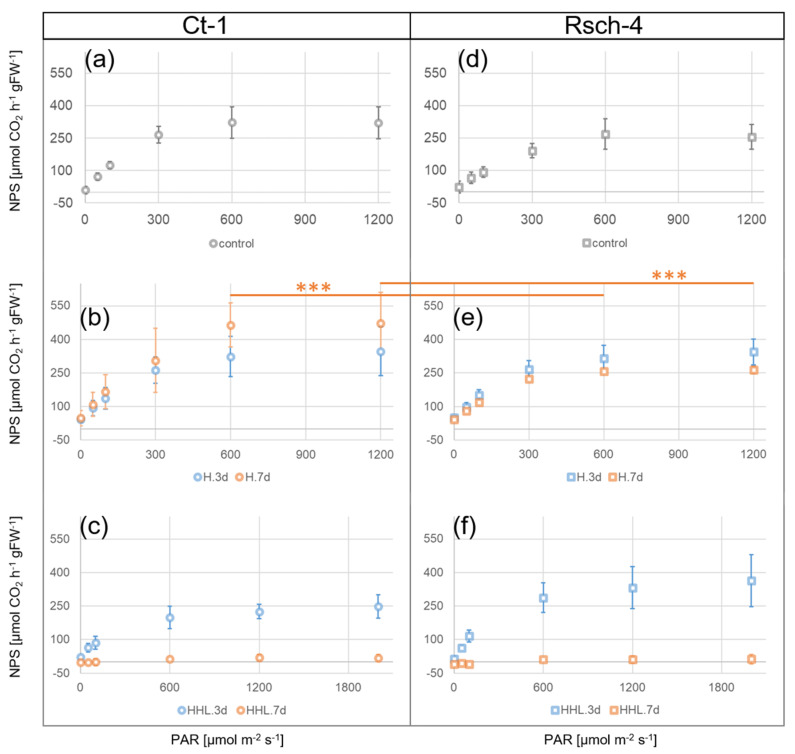
Figure 1.
Light response curves of net photosynthesis (NPS) after exposure to heat (H) and heat/high light (HHL) for 3 days (blue) and 7 days (orange). (a) – (c) NPS of Ct-1 under (a) control (22 °C/100 µmol m−2 s−1), (b) heat (32 °C/100 µmol m−2 s−1), and (c) heat/high light (32 °C/600 µmol m−2 s−1). (d) – (f) NPS of Rsch-4 under (d) control (22 °C/100 µmol m−2 s−1), (e) heat (32 °C/100 µmol m−2 s−1), and (f) heat/high light (32 °C/600 µmol m−2 s−1). Asterisks indicate significance (ANOVA): *** p < 0.001. Circles (Ct-1) and squares (Rsch-4) represent mean values ± SD (n = 3–4).

