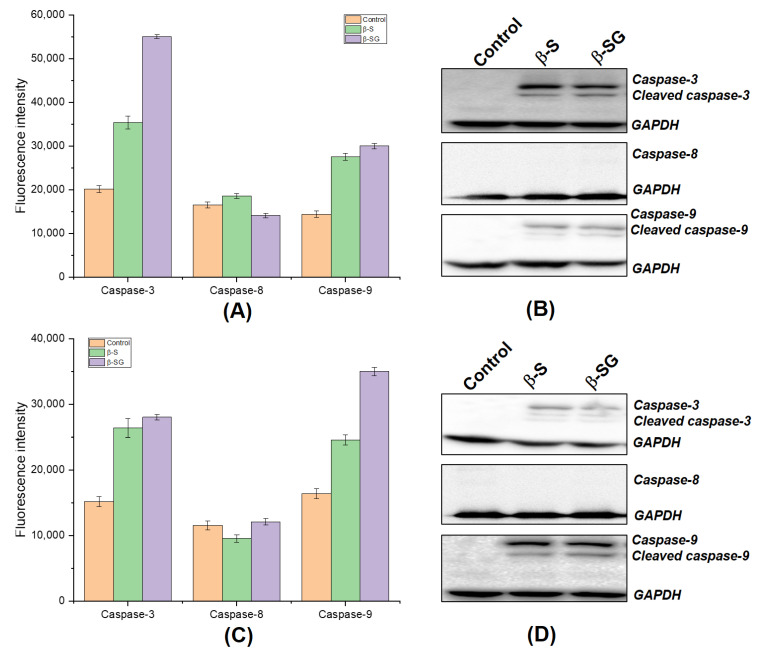
Figure 8.
β-S and β-SG induced the death of liver cancer cells through caspase-dependent pathways. Measurement of the fluorescence intensity in response to caspase activities on HepG2 (A) and Huh7 (B) cells. Protein expression analysis of anti-active and its cleaved caspase-3, -8, and -9 on HepG2 (C) and Huh7 (D) cells. GAPDH was used as a loading control.

