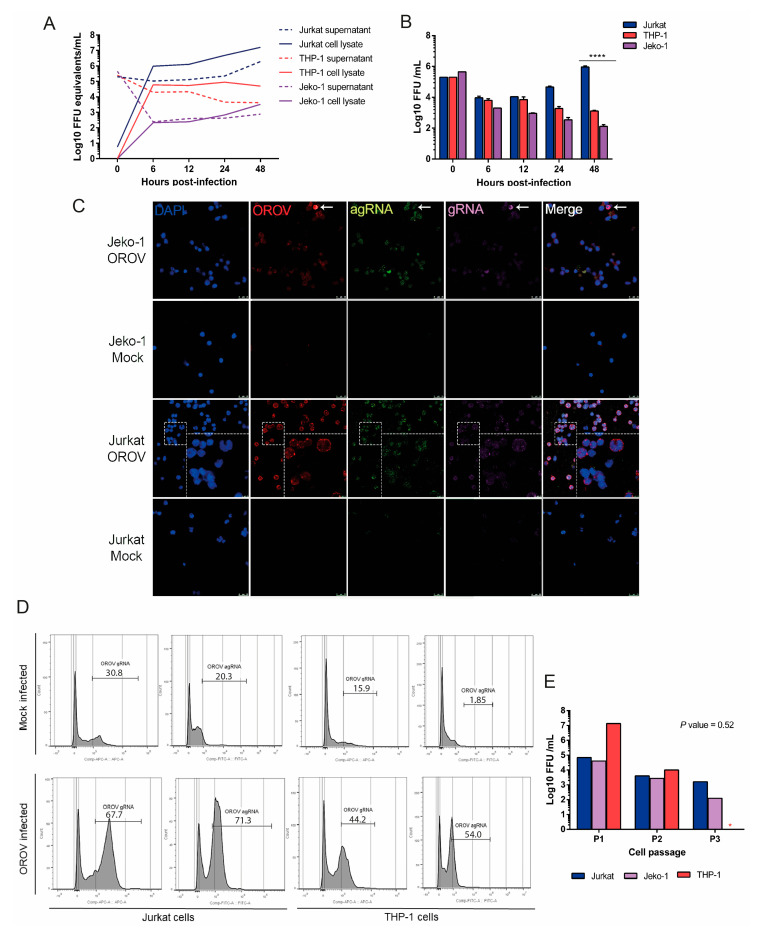
Figure 2.
OROV productively infect different human leucocyte lineages. Jurkat, THP-1 and Jeko-1 cells were seeded in 24-well plates and infected with OROV. Cells, supernatants and cell lysates were collected for evaluation by different methodologies. (A) Infection at MOI 1 and OROV RNA measured in cellular lysates and supernatants by qRT-PCR for OROV segment S. Lines represent the mean of viral load ± SEM (B) FFA analysis of the supernatants. Jurkat cells’ productive viral replication was significantly different from THP-1 and Jeko-1 cells at 48 hpi. Tukey’s multiple comparison test was performed and the p-value < 0.0001 is represented by ****. (C) Detection of OROV 48 hpi in cells infected at MOI 2 by confocal microscopy. OROV proteins in red (Alexa Fluor 594); genome (gRNA) in magenta (AlexaFluor 647); antigenome (agRNA) in green (AlexaFluor 488); DAPI (blue). Images with 63x times magnification. Scales at 25 μm, with 75 μm in zoomed images. (D) Flow cytometry detection of OROV gRNA and agRNA in Jurkat and THP-1 cells infected with MOI 1 at 24 hpi. Mock PF represents the mock infected cells that were submitted to the RNA PrimeFlow™ protocol. (E) Jurkat, THP-1 and Jeko-1 cells were infected with MOI 1 and subcultured several times. A sample of the supernatant was collected at each passage (P1, P2, P3) and analyzed by FFA. The THP-1 cell culture did not resist until passage 3 (P3; red asterisk). The Friedman test showed no significant difference in viral replication between the three lineages. The results of infection kinetics are representations of two independent experiments.

