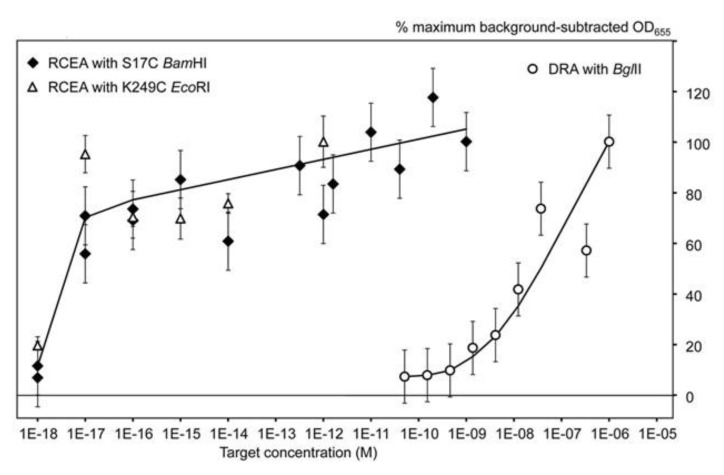
Figure 5.
From [8] (Creative Commons CC-BY-NC-ND license). The RCEA limit of detection evaluated using the oligonucleotide target AMC-BG. The X-axis shows the target concentrations (M) and the Y-axis shows the background-subtracted HRP signal values (with the background calculated as the mean signal generated for zero target concentrations). For normalization and comparison of sample series, the HRP signal values were expressed as the percentages of the maximum background-subtracted OD655, corresponding to each series. Open circles show the data generated using the direct restriction assay (DRA) with no amplification. The other two series were generated using the RCEA assays with the mutant S17C BamHI (closed diamonds) and K249C EcoRI (open triangles) as amplification REases. Error bars show standard deviations.

