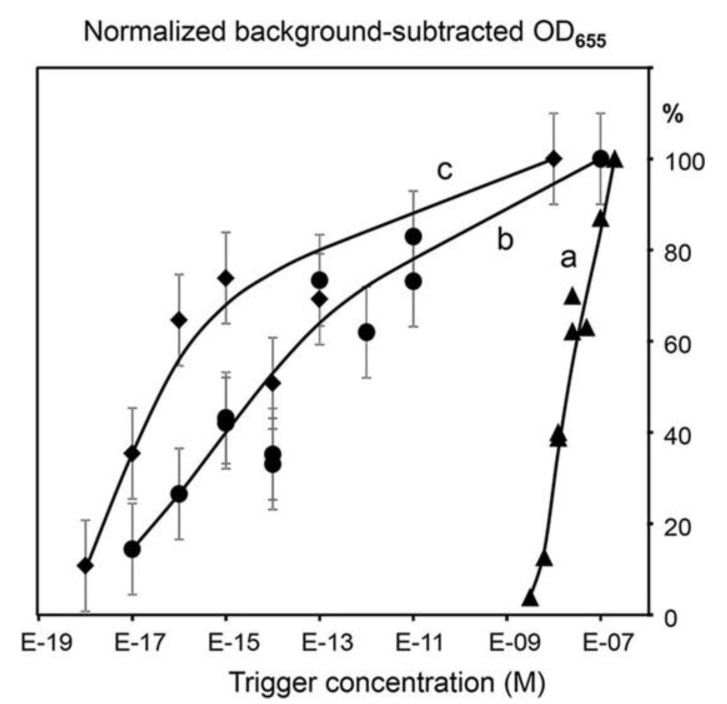
Figure 7.
From [10] (Creative Commons CC-BY license). The dependence of the HRP-generated signal on the concentration of the amplification trigger added to the single (non-amplified DRA format) REase (a) or the two REases EcoRV and SspI (b-c) systems. The curves a and b are generated for mixtures of the two bead types, one modified with the amplification probe AP1-HRP and the other with AP2-HRP. The curve c was obtained for the same two bead types separated by a filter barrier. The X-axis shows the target concentrations (M), and the Y-axis shows the background-subtracted and normalized HRP signal values. The background was calculated as the mean signal generated for the triplicate no-trigger added negative controls. For normalization and comparison of the sample series, the HRP signal values are expressed as the percentages of the maximum background-subtracted OD655 corresponding to each series. Error bars show standard deviations. The data for (non-amplified DRA format) REase (a) were obtained without replicates.

