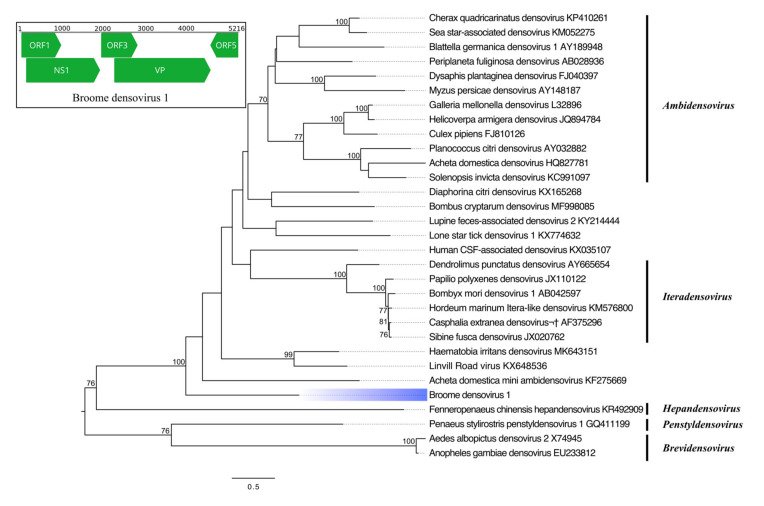
Figure 4.
Phylogenetic analysis of Broome densovirus 1. The maximum likelihood tree was constructed using NS1 protein sequences. The scale bar represents units of substitutions per site, and bootstrap support values are displayed when greater than 70%. Viruses identified in this study are highlighted in blue. Inset: Genome organization of Broome densovirus 1. Open reading frames (ORF) are indicated by green arrows, while nucleotide positions are shown above the genome. NS1, non-structural protein 1; VP, viral capsid protein.

