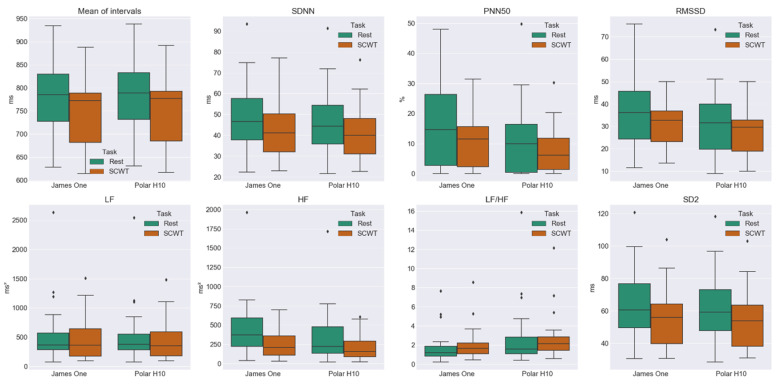
Figure 7.
Box plots of the comparison between the HRV metrics obtained during the rest task and the SCWT. Each boxplot is divided by a bar that represents the median (50th percentile). The spaces between the middle bar and the top and the bottom of the box indicate the 75th and 25th percentiles, respectively. The IQR is the distance between the 75th and 25th percentiles. The whiskers that extend from the boxes represent the maximum (75th + 1.5 × IQR) and the minimum (25th − 1.5 × IQR) limits, in which a value is not regarded as an outlier. Values plotted outside these whiskers are considered outliers and are shown as ♦.

