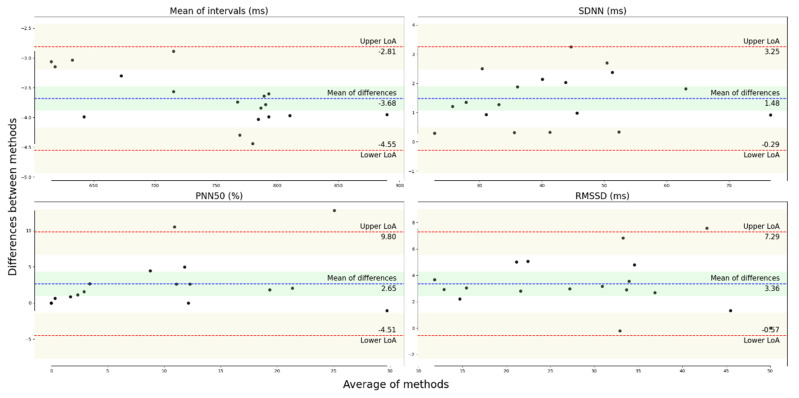
Figure A3.
Bland–Altman plots for the pairs of time-domain metrics obtained during the SCWT. The blue line and area represent the mean of the differences between measurements and the associated confidence interval. The red lines and the associated area represent the upper and lower LoA and the associated confidence intervals.

