Figure 1.
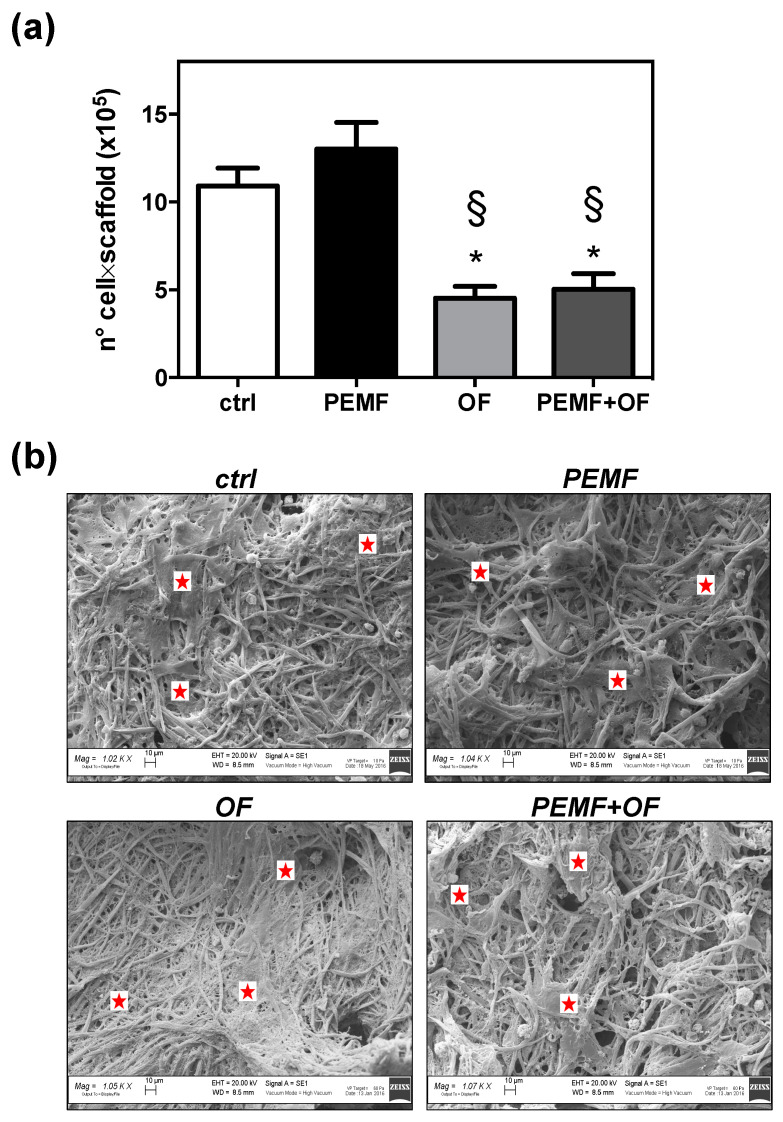
(a) Cell growth evaluation has been assessed by means of DNA quantification at day 21 of culture. Bars represent the mean values ± SD (standard deviation) of results (N = 3; n = 3, symbols indicate statistical significance vs. control (*) and vs. PEMF (§)). (b) Cell morphology assessed by SEM on all samples (scale bars = 10 μm; magnification: ctrl = 1020×; PEMF = 1040×; OF = 1050×; PEMF + OF = 1070×). Red stars indicate cell distribution on the wool keratin scaffolds in all conditions. In OF and PEMF + OF the dense layer of extracellular bone matrix (ECM) made difficult to discriminate a cell from another. Representative live cells visualized by fluorescein diacetate (FDA) staining on the scaffold’s surfaces are shown in Figure S3.

