Figure 3.
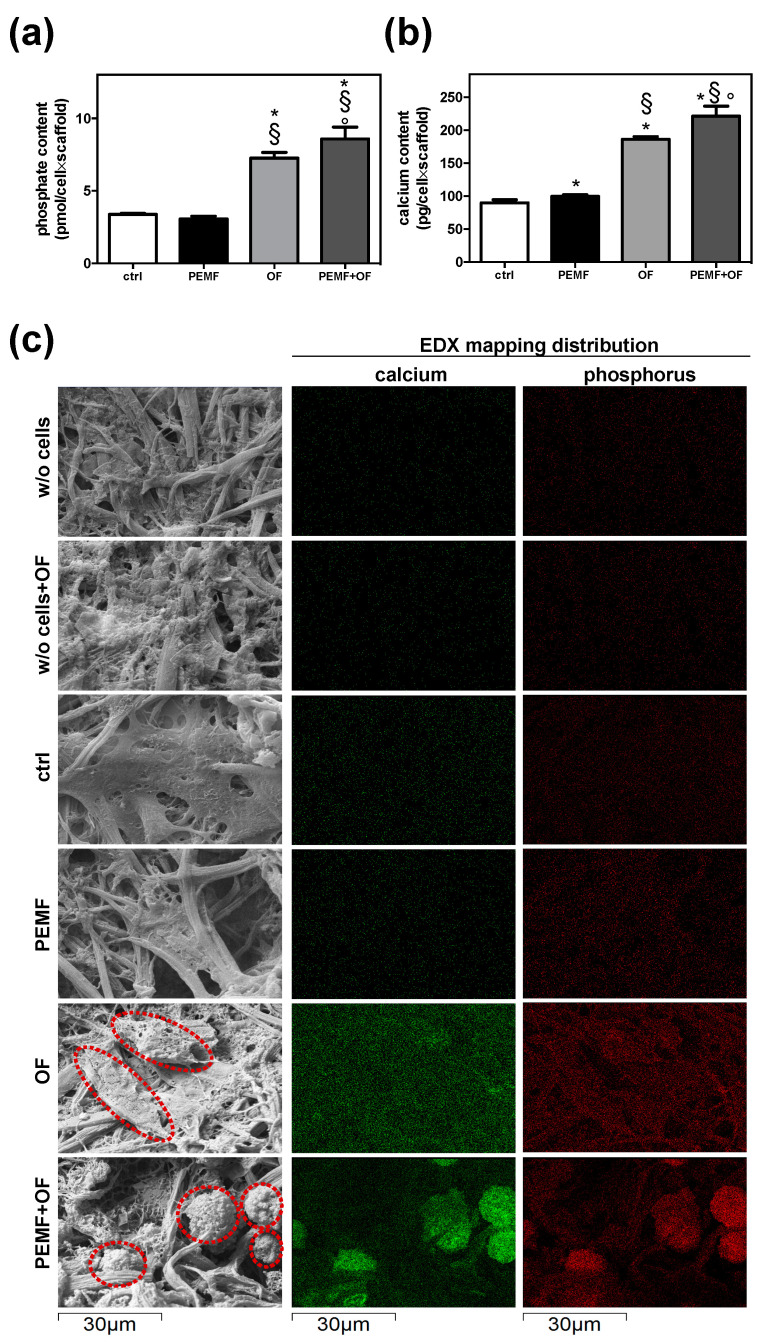
Quantification of inorganic matrix produced for 21 days. (a) Quantification of phosphate content by Phosphate Colorimetric Assay kit. Phosphate is measured in pmol/cell×scaffold; results are presented as mean ± SD (N = 3; n = 2; symbols indicate statistical significance vs. control (*), vs. PEMF (§) and vs. OF (°)). (b) Quantification of calcium content by the Ca2+/o-cresolphthalein complexone method. Results are expressed as pg/cell×scaffold and presented as mean ± SD (N = 3; n = 2, symbols indicate statistical significance vs. control (*), vs. PEMF (§) and vs. OF (°)). (c) Scanning Electron Microscopy with Energy Dispersive X-ray Spectroscopy (SEM-EDX) analysis of calcium and phosphorous deposits. Representative SEM pictures show the presence of inorganic deposits (indicated with red dotted circles) in particular in cells cultured in wool keratin scaffolds and treated for 21 days with PEMF + OF. EDX elemental mapping of calcium (green) and phosphorus (red) relative to the SEM pictures (dimension: 64.68 × 43.12 μm). All EDX analyses were conducted with an accelerating voltage of 20 kV and under low vacuum conditions. Wool keratin scaffolds cultured in maintenance medium in absence of cells (w/o cells) and with OF (w/o cells + OF) for 21 days were included as control. In both these conditions, the calcium and phosphorus signals were negligible.

