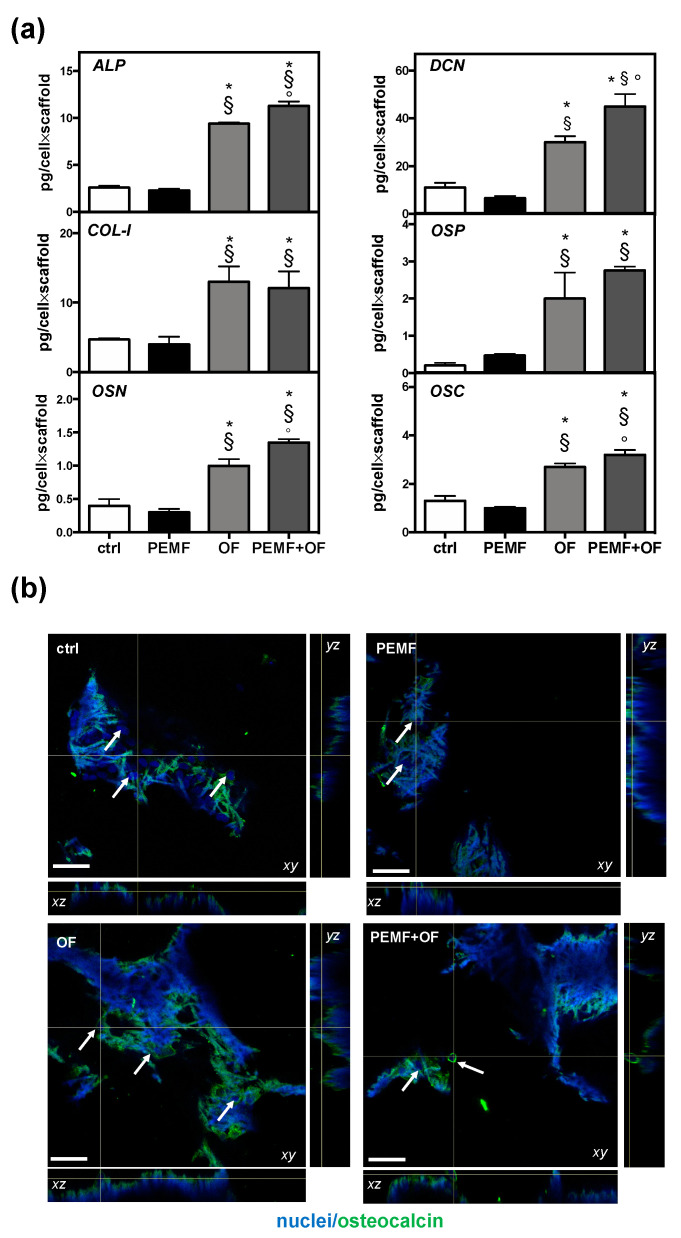
Figure 5.
Bone osteogenic protein production by cells onto wool fibril sponges in the different conditions after 21 days of culture. (a) Quantification of indicated osteogenic proteins quantified by ELISA assay. Data are expressed as pg/cell×scaffold (N = 3; n = 2, symbols indicate statistical significance vs. control (*), vs. PEMF (§) and vs. OF (°)). (b) Representative orthogonal view of Confocal Laser Scanning Microscope (CLSM) images of bone osteocalcin immunolocalization (green) are shown with xy, yz, and xz planes. Nuclei (blue) were counterstained with Hoechst 33342. White arrows indicate the scaffold areas containing cells. Magnification 20×; the scale bar represents 50 µm. Negative control for non-specific staining of the secondary antibody and Tissue Culture Plates (TCPS) controls are shown in Figure S4.

