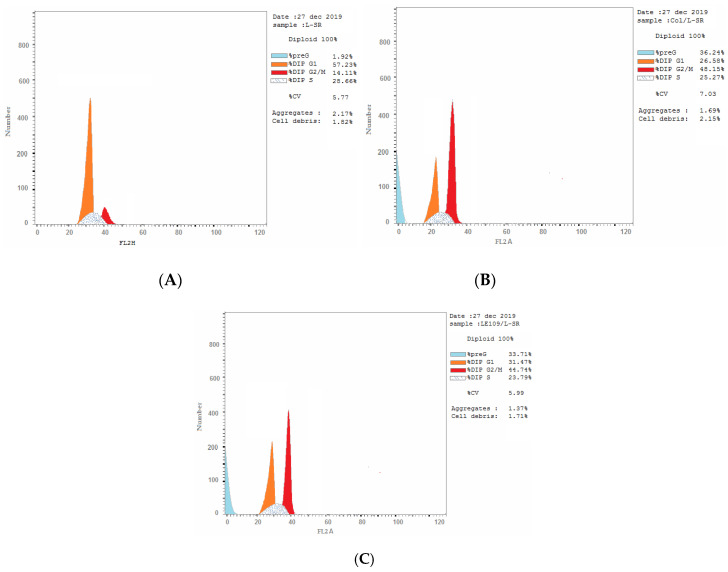
Figure 10.
Cell-cycle analysis of SR cells treated with annexin PI at IC50. Concentration representing growth arrest at the pre-G1 (G0) and G2/M phases. (A) Untreated cells; (B) treated cells with colchicine; (C) treated cells with 3a. The test was repeated three times, while 3a and the reference were incubated for 24 h (2 × 10⁵ cells/well) at 37 °C.

