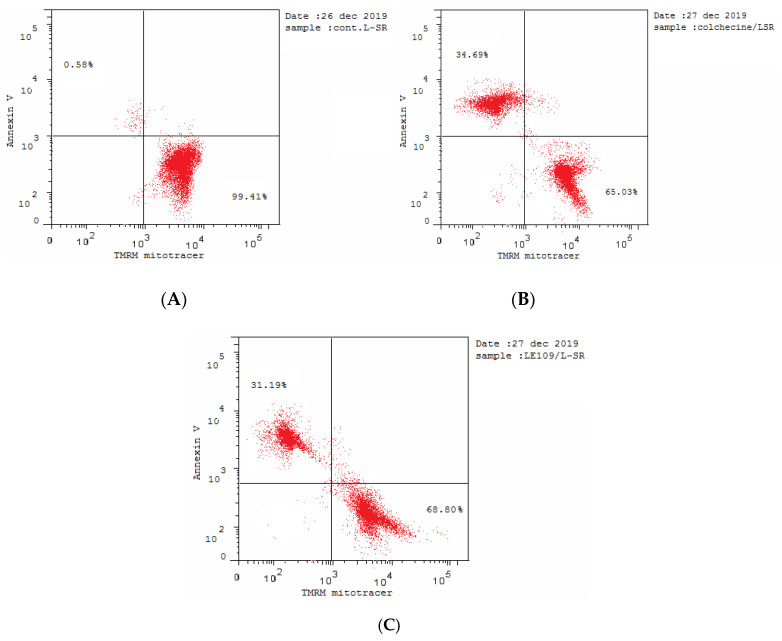
Figure 12.
Contour diagram of annexin V/PI flow cytometry illustrating induction of the loss of mitochondrial membrane potential (Δψmt) against SR cancer cell line. (A) Untreated cells; (B) treated cells with colchicine; (C) treated cells with 3a. (B and C were performed at concentrations of 20, 10, 5, 2.5, 1.2, 0.63, and 0.31 ng/mL). The tests were repeated three times and the substrate was incubated at 37 °C in the dark for 15–30 min.

