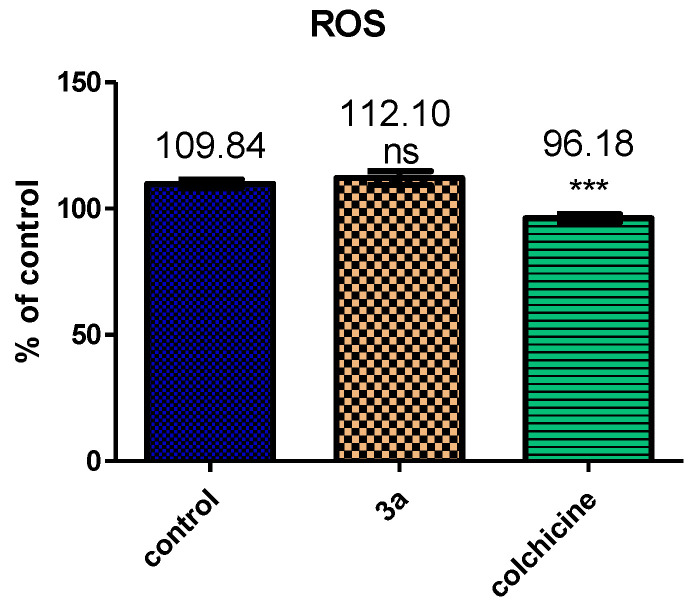
Figure 13.
Mitochondrial production of ROS in SR cells with 3a and colchicine reference compared to control. Mean ± standard deviation plotted for three replicates per condition. Results are significantly different from control at *** p < 0.05. The substrate was incubated for 30 min at 37 °C protected from light.

