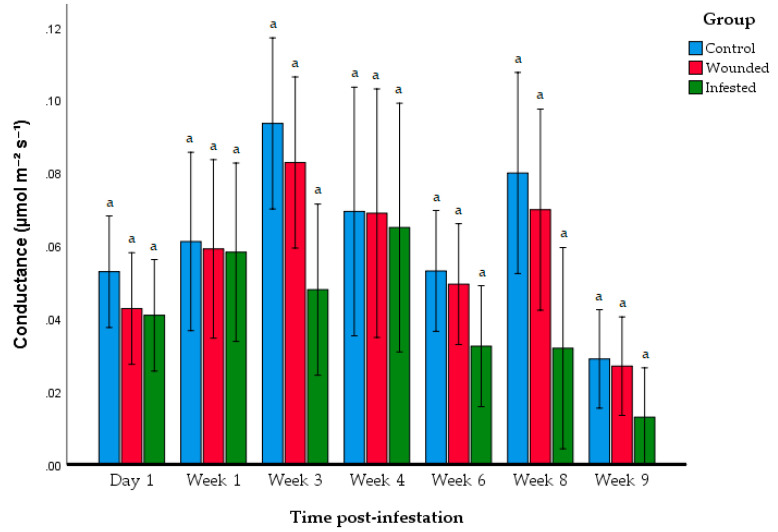
Figure 5.
Stomatal conductance of each group at at different periods after infestation. Data shown as mean + S.D. Different letters indicate significant differences among the control, wounded, and infested group within each time post-infestation period based on ANOVA following the Tukey multiple comparison test (p > 0.05).

