Figure 4.
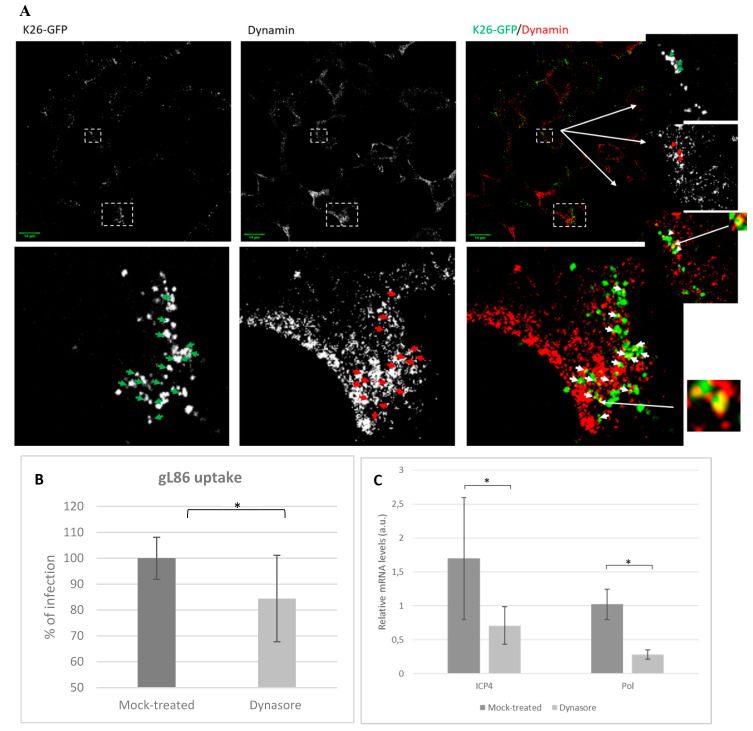
Infection of HOG cells treated with the dynamin inhibitor: (A) Co-localization of dynamin with HSV-1. HOG cells infected at an m.o.i. of 1 with K26-GFP were fixed at 15 min p.i. and processed for indirect immunofluorescence confocal microscopy with an anti-dynamin monoclonal antibody followed by an anti-mouse Alexa 555 secondary antibody. Images correspond to 0.8 μm confocal slices. Arrows point to possible co-localization events of virions with dynamin. Dashed squares show the location of enlarged images (bottom and right) on the confocal fields. (B) Confluent monolayers of HOG cells treated or mock-treated with dynasore 50 μM were infected with a recombinant HSV-1 (KOS) gL86 at an m.o.i. of 5. After 6 h p.i., the β-galactosidase activity (absorbance at 410 nm) was analysed in a microplate reader. The bars show the average infection based on the optical density (OD). (C) RT-qPCR of mRNAs: Bars represent relative mRNA levels corresponding to ICP4 and polymerase (Pol) extracted at 3 h p.i. from HSV-1 wild-type-infected HOG cells treated or mock-treated with dynasore 50 μM. (a.u., arbitrary units.) Values are reported as the mean ± S.D. (n = 3), relative to uninfected controls (* p < 0.05).

