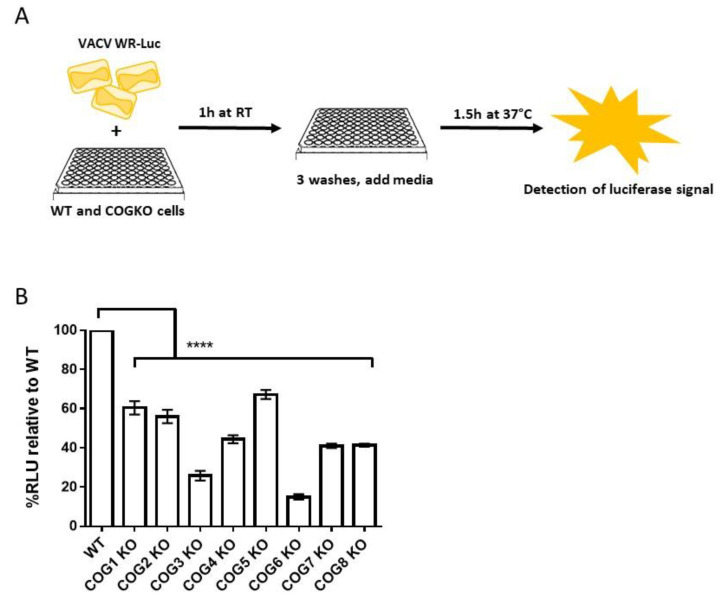
Figure 2.
Lower virus entry in cells lacking COG genes. (A) Schematic representation of the luciferase-based viral entry assay; (B) Percent luciferase signal relative to WT in WT and COG KO cells infected with VACV-WR-LUC. Bars represent the mean of 3 replicates and error bars represent standard error. All groups compared to WT using a one-way ANOVA and Dunnett’s multiple comparison test: **** p < 0.0001.

