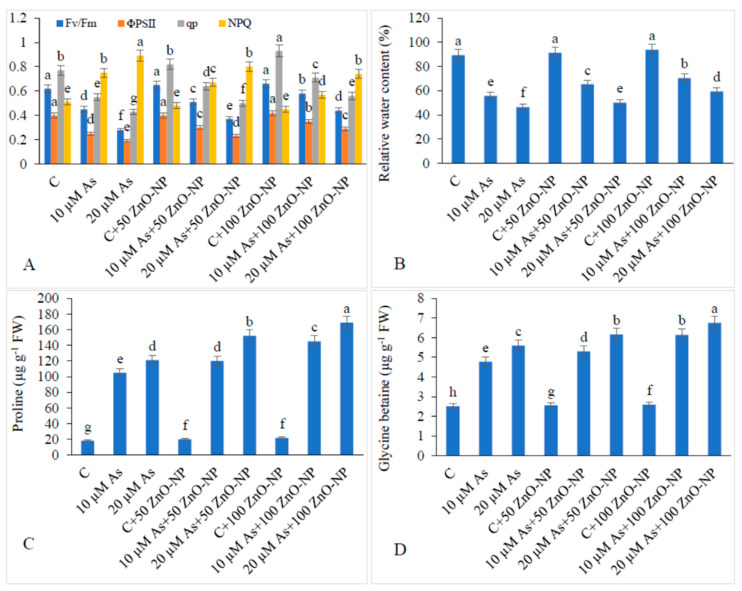
Figure 3.
Effect of different concentrations of As and ZnO–NP on (A) chlorophyll fluorescence, (B) relative water content, (C) proline content and (D) glycine betaine content in soybean plants. Different letters indicate significant difference between the treatments. The data are the means ± SE (n = 5).

