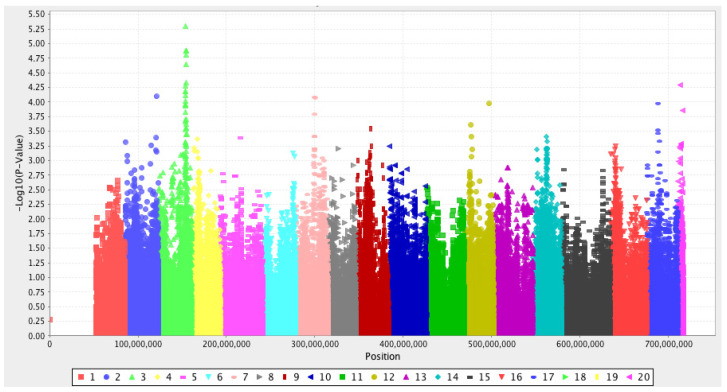
Figure 1.
A Manhattan plot displays associations between data for lesion decay of 180 Penicillium expansum-inoculated apple cultivars and SNPs (single nucleotide polymorphism) in the Axiom®Apple 480K array for DNA samples of the same cultivars (Ahmadi-Afzadi, Muranty, Nybom, and Durel, unpublished). Genomic coordinates are shown along the x-axis with different colours according to which of the 17 apple-genome linkage groups each SNP is situated on, while the negative logarithm of the association p-value is displayed on the y-axis. A possible association is indicated on the bottom part of LG3 (bright green), but it was not statistically significant since the significance threshold (6.5) was higher than in most other GWAS due to the overall very large number of SNPs in the study.

