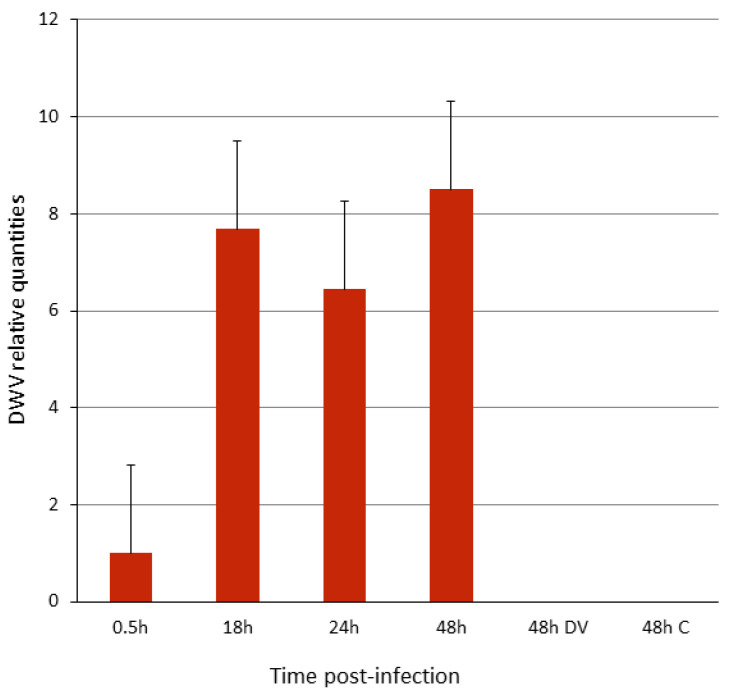
Figure 2.
Infection of P1 cells with DWV. Y-axis, relative amount of DWV genomic copies, normalized expression in respect to the virus bound to the cells for 0.5 h of incubation and wash. X-axis, h, hours; DV, heat-inactivated virus inoculum; C, mock-infected cells (see Materials and Methods, Section 2.3). Bars represent standard error values. One-way ANOVA (F = 4.8581, P = 0.041).

