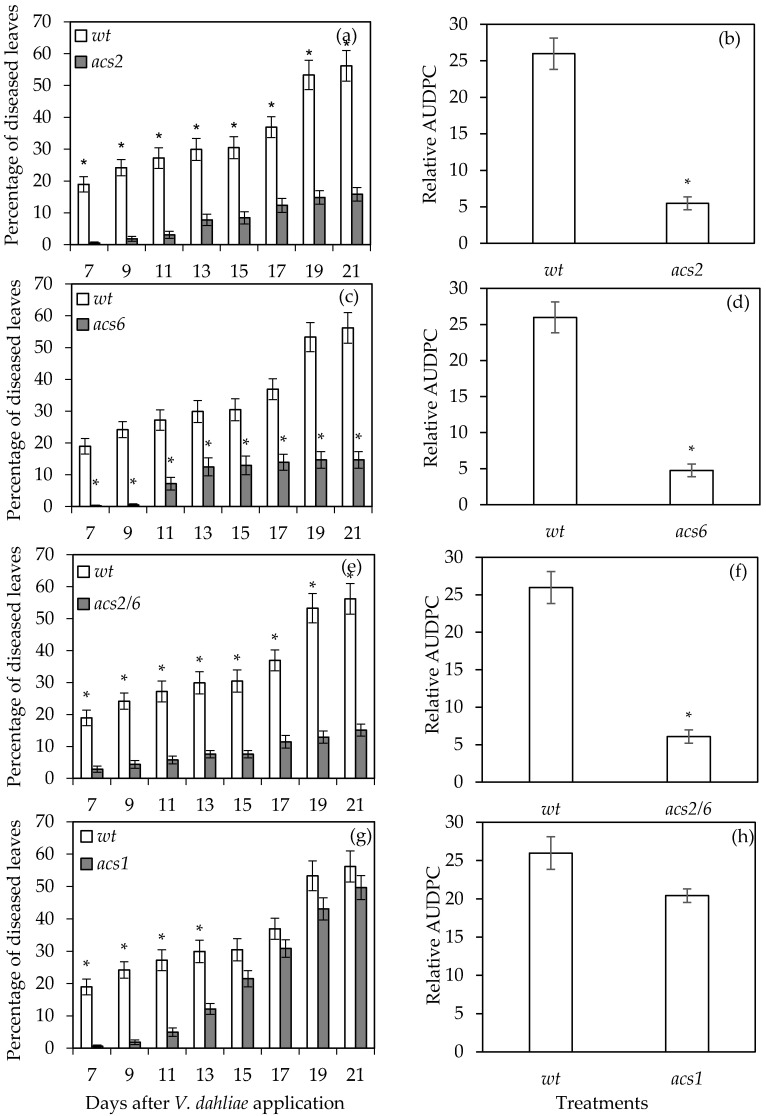
Figure 1.
Disease severity (a,c,e,g) and relative area under the disease progress curve (AUDPC) (b,d,f,h) on Arabidopsis thaliana wild type and 1-aminocyclopropane-1-carboxylic acid synthase (acs)2, acs6, acs2/6, and acs1 mutants inoculated with Verticillium dahliae. Each treatment consisted of 10 plants and the experiment was repeated three times. Columns represent means of the three replications (30 plants) and the vertical bars indicate standard errors. Columns with asterisks (*) are significantly different (p < 0.05) from wild type (wt) according to a t-test.

