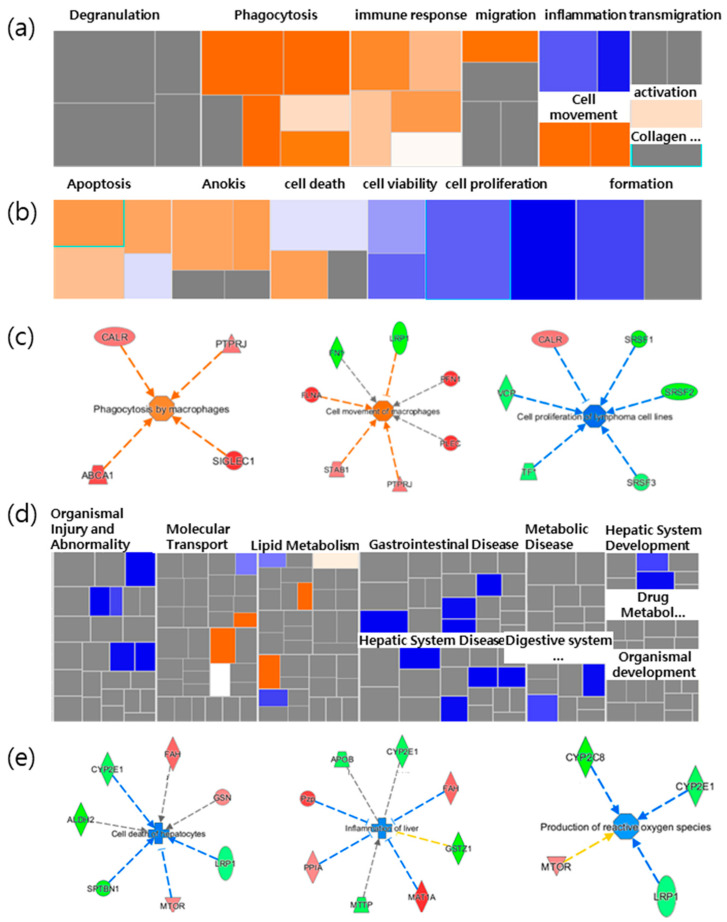
Figure 2.
Heatmap analysis of selected functions related to spleen and liver. The heatmap showed (a) inflammatory response related to immunological functions and (b) cell death and survival related to cancer in the spleen. (c) Selected increased immunological functions, and the cell death and survival function of cancer in the spleen. (d) The heatmap panel shows hepatic functions in the liver. (e) Selected decreased typical function in the liver led to cell death of hepatocytes, inflammation of the liver, and the production of reactive oxygen species (ROS) in the liver. Each box represents a biological process or disease. The color of the box (a,b,d) and the proteins (c,e) indicates the predicted increase or decrease. Orange boxes represent biological processes or diseases that are trending toward an increase. Blue boxes represent biological processes or diseases that are trending toward a decrease. Grey boxes represent biological processes or diseases that are not predictable (currently ineligible for a prediction). NFP is a non-saponin fraction with rich polysaccharide.

