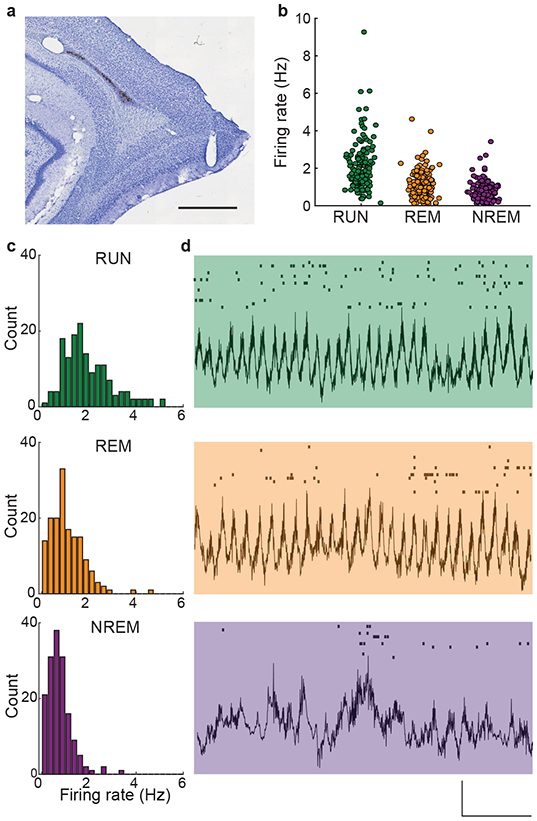
Figure 1. Grid cell firing rates varied across active and sleep states.

(a) An example histological section shows a tetrode track in the superficial layers of the medial entorhinal cortex. Scale bar is 1 mm.
(b) The firing rates of grid cells (n = 157) differed significantly across behavioral states (F(2,312) = 124.3, p = 2.00e-40, η2 = 0.277). Firing rates were highest during active ambulation (RUN: 2.04 ± 0.10 Hz), lowest during NREM sleep (0.76 ± 0.04 Hz), and at an intermediate level during REM sleep (1.08 ± 0.06 Hz). Each marker corresponds to an individual grid cell.
(c) Histograms show the distributions of firing rates across grid cells segregated by behavioral state.
(d) Representative examples of LFP epochs are presented with simultaneous spike rasters from an example ensemble of grid cells plotted above each trace. Each row of the raster plots corresponds to a single grid cell. Activity from the same ensemble of grid cells is shown in each behavioral state. Vertical scale bar is 500 μv, horizontal scale bar is 1 s.
