
Figure 2. Cross-correlations between grid cell spike times were related to the degree of overlap in grid cell rate maps across active waking behaviors and sleep.
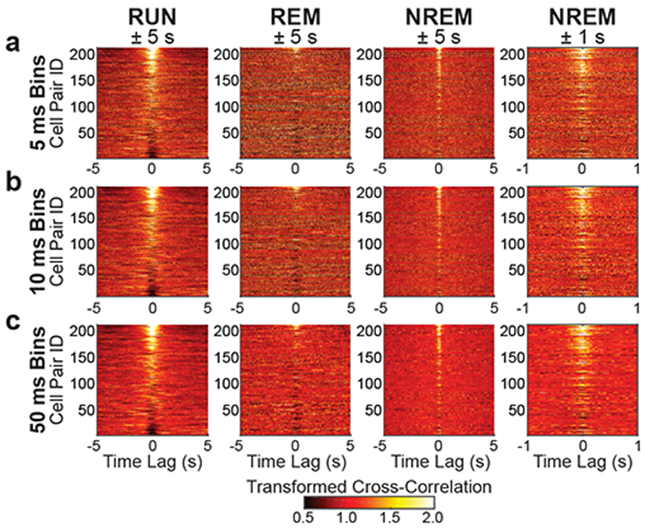
(a-c) Each panel shows color-coded spike-time cross-correlations (divided by their average; see Methods) for all pairs of grid cells sorted from highest rate map correlation coefficient (highest Cell Pair ID) to lowest rate map correlation coefficient (lowest Cell Pair ID) (See Methods). The leftmost three columns show results for RUN, REM, and NREM and are plotted across time lags of ± 5 s. The rightmost column shows results for NREM plotted across time lags of ± 1 s. Note that similar qualitative relationships between spike-time cross-correlations and grid cell rate map correlations are maintained across all three behavioral states and for spike trains binned with varying degrees of temporal resolution (i.e., 5 ms bins in a, 10 ms in b, and 50 ms in c). See Supplementary Figure 1 for a reproduction of these results using a different method of cross-correlation normalization.