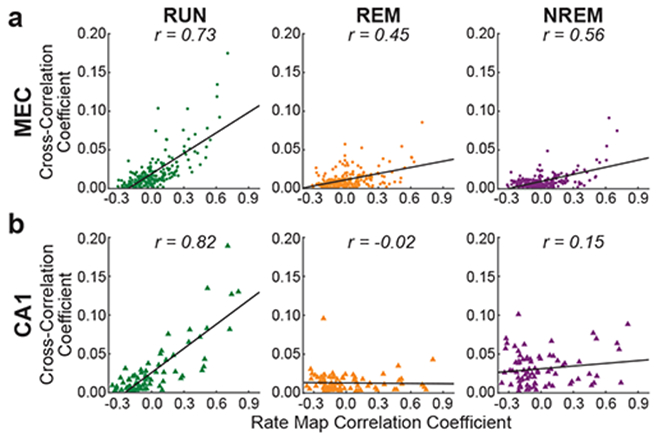
Figure 3. The relationship between spatial overlap and spike-time cross-correlations was preserved across waking and sleep states for grid cell pairs but not CA1 place cell pairs.

Spike-time cross-correlation coefficients were summed across a ± 5 ms time lag. Each dot in a scatterplot represents a cell pair’s rate map correlation coefficient and summed spike train cross-correlation coefficient (MEC: n = 211 cell pairs; CA1: n = 78 cell pairs). Each plot also shows the best-fit line in black and the associated correlation coefficient, Pearson’s r.
(a) For all grid cell pairs and across all three behavioral states, positive correlations were observed between spike-time cross-correlations and grid cell rate map correlation coefficients.
(b) Pairs of CA1 place cells exhibited a significant positive correlation between summed spike-time cross-correlation coefficients and place cell rate map correlation coefficients during active waking behaviors, but that relationship was not maintained during REM or NREM sleep.
