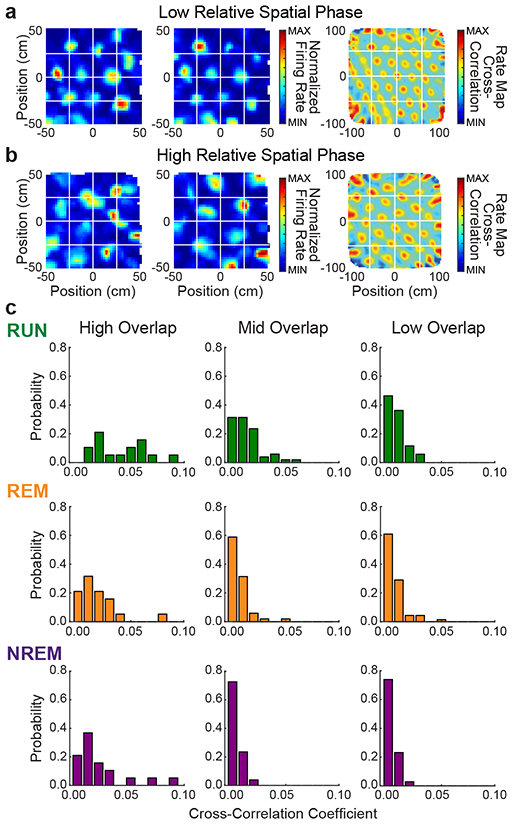
Figure 6. Grid cell pairs with overlapping grid fields exhibited a greater proportion of high spike-time cross-correlations across active and sleep states.

(a) Color-coded rate maps (left two columns) and rate map cross-correlation (right column) for an example grid cell pair with low relative spatial phase (i.e., high grid field overlap).
(b) Same as A but for an example grid pair with high relative spatial phase (i.e., low grid field overlap).
(c) Probability density functions for normalized spike-time cross-correlation coefficients summed over ± 5 ms time lags. Grid cell pairs were sorted into High Overlap (left column), Mid Overlap (center column), or Low Overlap (right column) categories, corresponding to low, moderate, and high relative spatial phase magnitude values, respectively. For all three behavioral conditions, grid cell pairs in the High Overlap category were more likely to exhibit relatively high spike-time cross-correlations, and grid cell pairs in the Low Overlap category were more likely to exhibit low spike-time cross-correlations.
