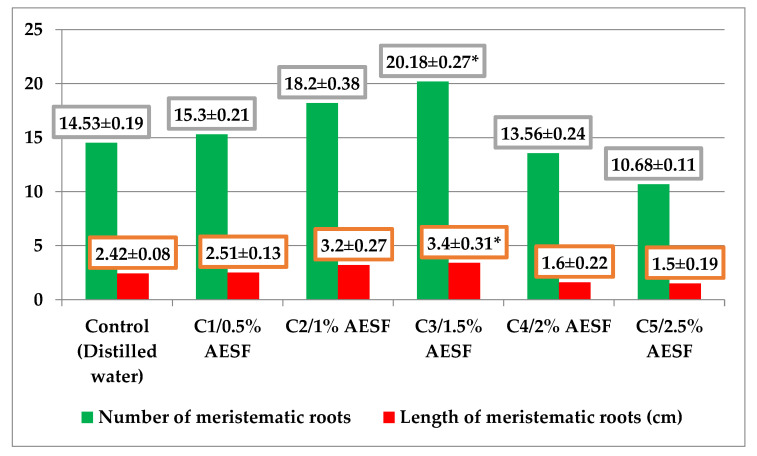
Figure 2.
Graphical representation of the macroscopic effects induced by different concentrations of AESF for the A. cepa species (average values ± standard error of mean-SEM). * significant at p ≤ 0.05, compared to the control (LSD test at a probability level of 0.05% subsequent to ANOVA analysis).

