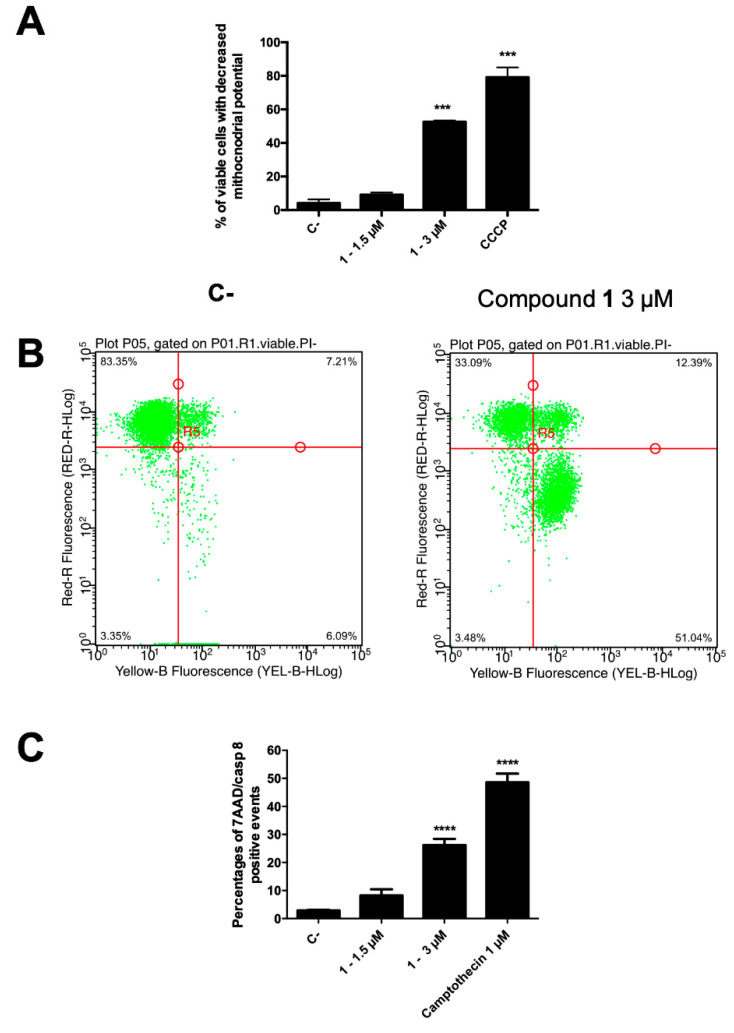
Figure 5.
(A) Percentage of 7-AAD+ and 7-AAD− cells and (B) representative dot plot of 7-AAD− cells with decreased mitochondrial potential of 1-treated CCRF–CEM cells stained with DiIC1(5) and annexin V–phycoerythrin and 7-AAD; (C) percentage of apoptotic cells with active caspase-8. *** p < 0.001; **** p < 0.0001 versus untreated cells. CCCP: carbonyl cyanide 3-chlorophenylhydrazone. C-: control.

