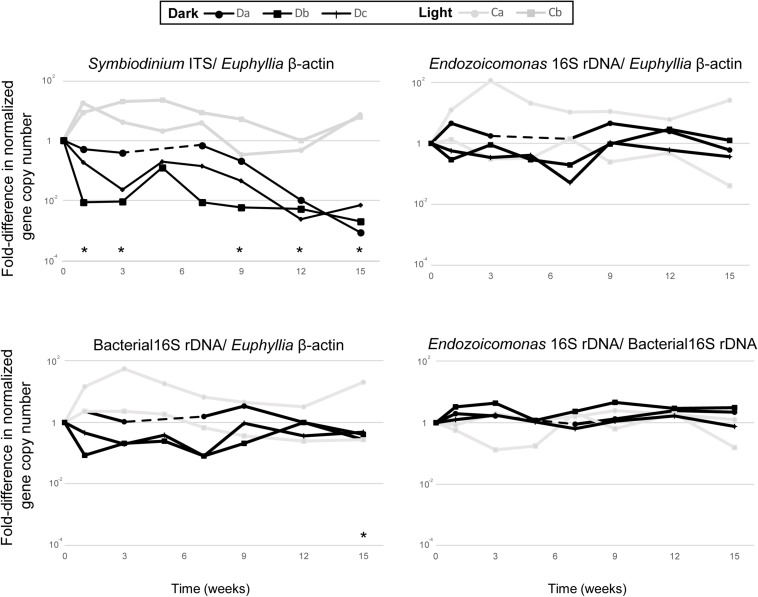
FIGURE 2.
The comparative qPCR results for variation in the abundance of Symbiodiniaceae ITS, Endozoicomonas 16S rRNA gene, and total bacteria 16S rRNA gene copy numbers—normalized by Euphyllia beta-actin gene copy numbers—and the relative abundance of Endozoicomonas 16S rRNA genes normalized by the copy numbers of total bacteria 16S rRNA genes. The black line represents dark-treated samples, and the gray line represents the light-treated samples. Asterisk denotes significant variation (p < 0.05) between samples under the dark treatment and samples before treatment. The dashed lines show missing data from the dark treatment at week five.

