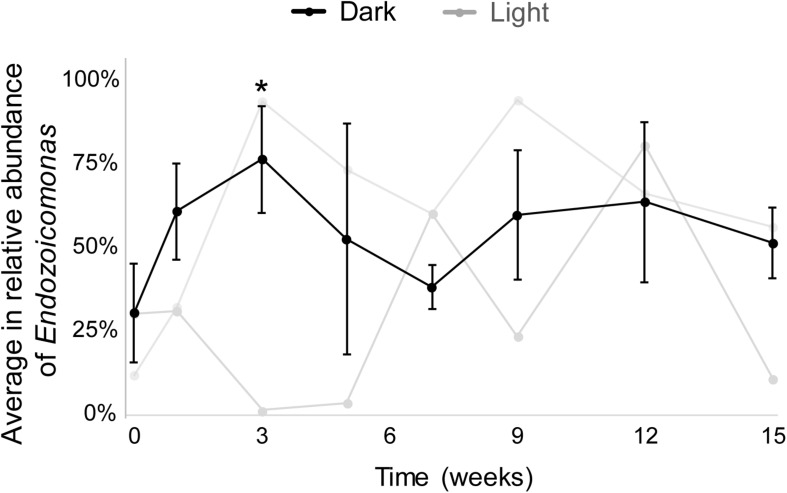
FIGURE 3.
The average relative abundances of Endozoicomonas throughout the experimental period. Black lines indicate dark-treated samples and gray lines indicate the system control samples. Standard deviations are marked only in dark-treated samples. Asterisk marks significant variation (p < 0.05) between samples under the dark treatment for three weeks and samples before the treatment.

