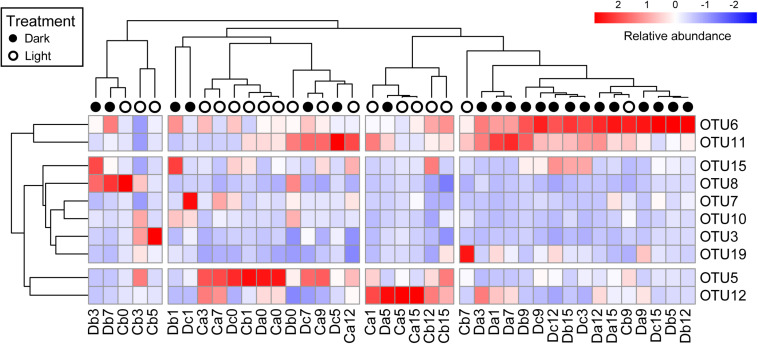
FIGURE 4.
Heatmap of top 10 OTUs in all coral samples after removal of Endozoicomonas OTUs. The top 10 OTUs on the y-axis comprised >1% relative abundance in all coral samples. Coral samples on the x-axis and OTUs on the y-axis were clustered based on Pearson correlation. Relative abundance of the top 10 OTUs in samples is presented (after transformation with a z-score). Red boxes present higher abundance, whereas blue boxes indicate lower abundance. Sample names on the x-axis with black or white circles indicate that the samples were under darkness or light, respectively, regardless of the sampling times.

