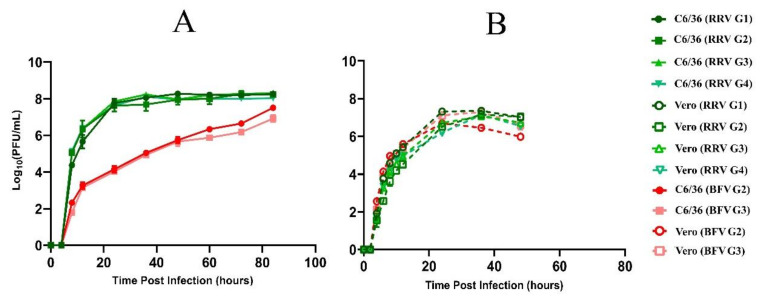
Figure 5.
Replication kinetics of representative Ross River virus (RRV, green) and Barmah Forest virus variants (BFV, red) in C6/36 and Vero cell lines, over time. (A) Comparison of viral production (Log10 PFU/mL) of representatives of RRV genotypes 1–4 (G1–4) and representatives of BFV genotype 2 and 3 (G2–3) in C6/36 cells over time. (B) Comparison of viral production (Log10 PFU/mL) of RRV G1–4 and BFV G2–3 in Vero cells over time. Bars present the standard error of the mean between two independent infection experiments.

